VSTOCHASTIC RSI EMA CROSSOVER COMBINED WITH VMACD WAVEFINDER STRATEGY

Overview
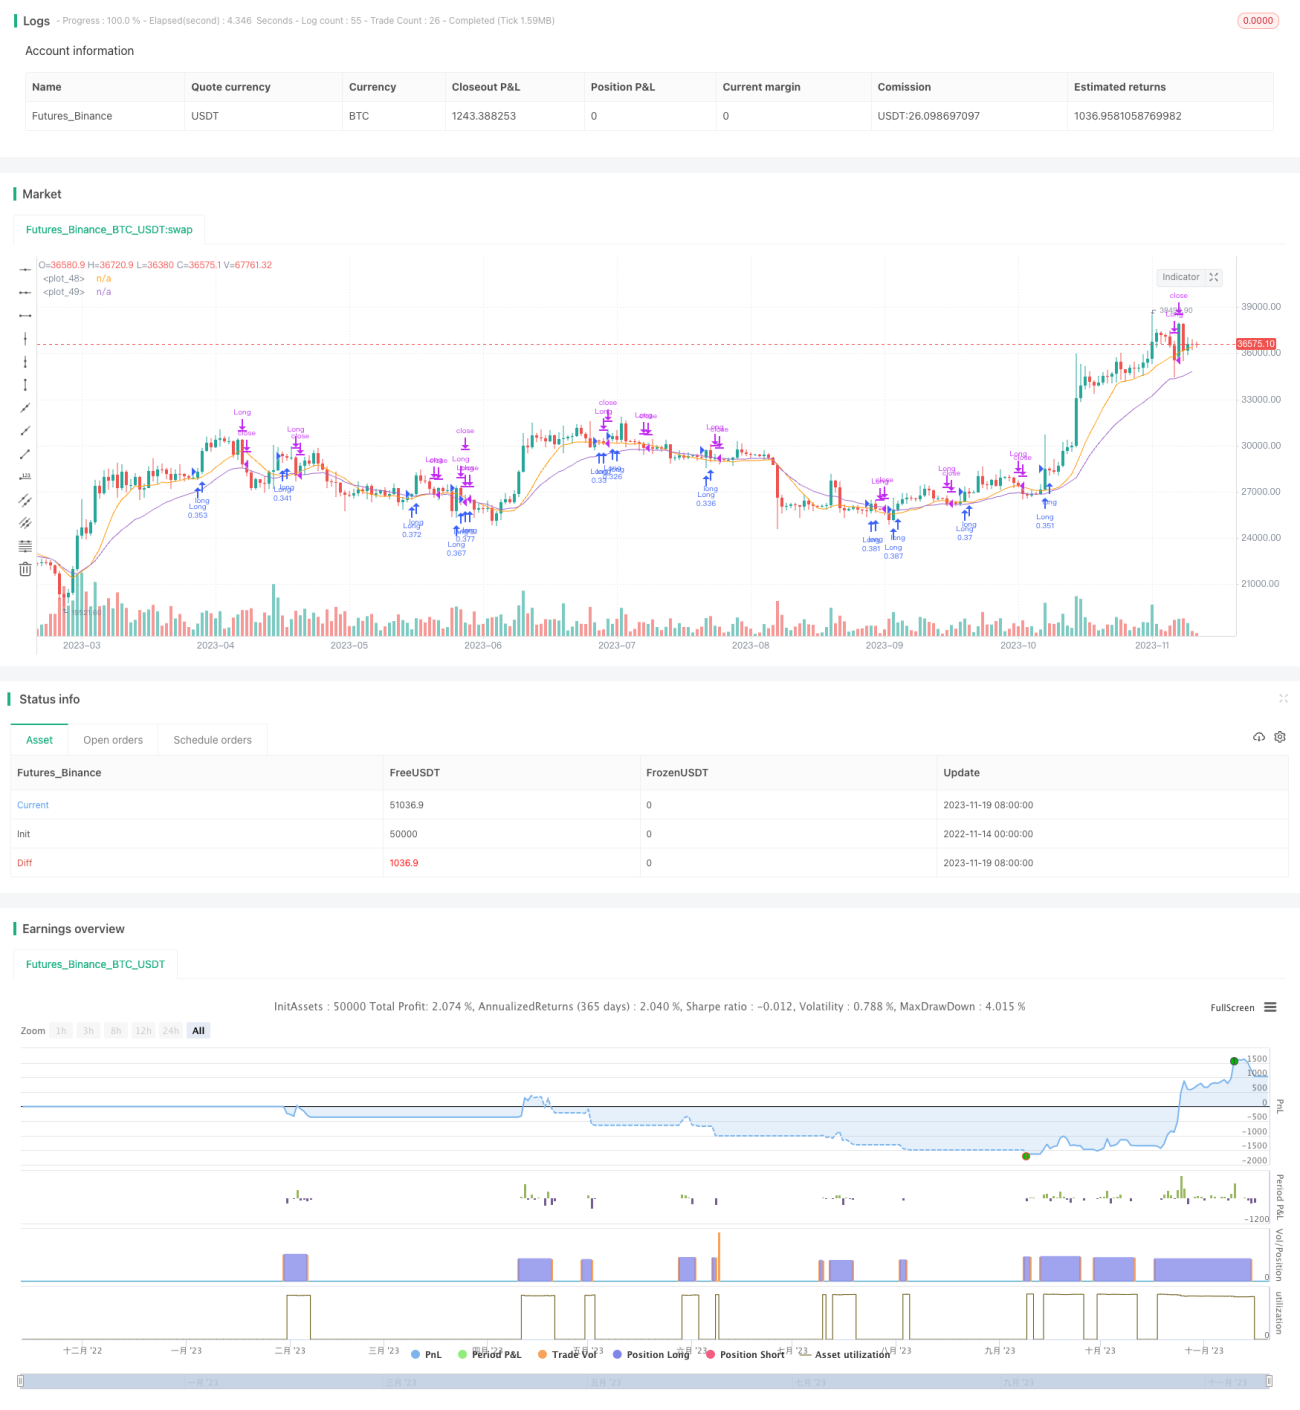
This is a strategy that incorporates Stochastic RSI, EMA crossovers and VMACD to identify market reversal points and performs best when a downtrend reversal is imminent. It will generate buy signals when conditions are met.
Strategy Logic
The strategy mainly relies on the combination of the following indicators:
- Stochastic RSI: To identify overbought and oversold conditions
- EMA Crossover between Fast EMA and Slow EMA: To determine trend direction and potential reversals
- VMACD: To confirm reversal signals
When Stochastic RSI bounces off the oversold region, the fast EMA crosses above the slow EMA, and at the same time VMACD starts to rise, a buy signal is generated. In addition, if the short term price breaks above the 10 period SMA, it also serves as an auxiliary signal to buy.
The strategy tracks the changes of these indicators in real time, and calculates SMA, EMA and other information over a fixed lookback period. When the buy conditions are triggered, it will buy and open position with a fixed number of contracts. Afterwards if the stop loss conditions are triggered, such as 5% drawdown or price below SMA line, positions will be closed for stop loss.
Advantage Analysis
The strategy combines multiple indicators and is capable of effectively identifying market reversal opportunities. The main advantages are:
- Stochastic RSI is strong at catching overbought and oversold conditions
- EMA crossover has high accuracy at determining reversal signals
- VMACD helps filter fake signals effectively
- Combining multiple indicators improves signal quality
- Using short term SMA as a stop loss method is reasonable
In summary, this strategy can effectively capture reversal signals, establish long positions after declines to a certain degree, and thus gain profits.
Risk Analysis
Despite having some edge, there are also risks to note for this strategy:
- Market may not reverse and continues to decline - systematic risk
- Probability of multiple indicators triggering buy together is not high - few signals
- SMA stop loss could be too subjective and result in mediocre drawdown control
- Does not take into account high volatility market environments
Some ways to mitigate the risks:
- Add more reversal indicators for better combo effect
- Use timed stop loss combined with amount based stop loss
- Judge market conditions and avoid taking positions in choppy environments
- Optimize stop loss logic to prevent over-aggressive stop loss from being stopped out
Optimization Directions
Main areas that could be optimized for the strategy:
- Add more indicators to form an indicator cluster, improving signal quality
- Select optimal parameters based on characteristics of different asset classes
- Incorporate machine learning models to estimate reversal probability based on historical data
- Add slippage when backtesting to make results closer to live performance
- Refine stop loss methodology to become more smooth and reasonable
- Detect trend conditions to distinguish ranging and trending environments before entering positions blindly
Conclusion
Overall this VRSI-EMA Crossover with VMACD Wavefinder Strategy is quite capable of catching downtrend reversal opportunities. It generates buy signals effectively by combining multiple indicators to determine optimal timing for reversals. However, there remains some areas for improvements. If further optimized, the strategy's performance in live trading could be even better. It represents a typical example of a quantitative strategy based on the fusion of multiple indicators.
- 1