Dual Moving Average Reversal Strategy

1
Follow
1779
Followers
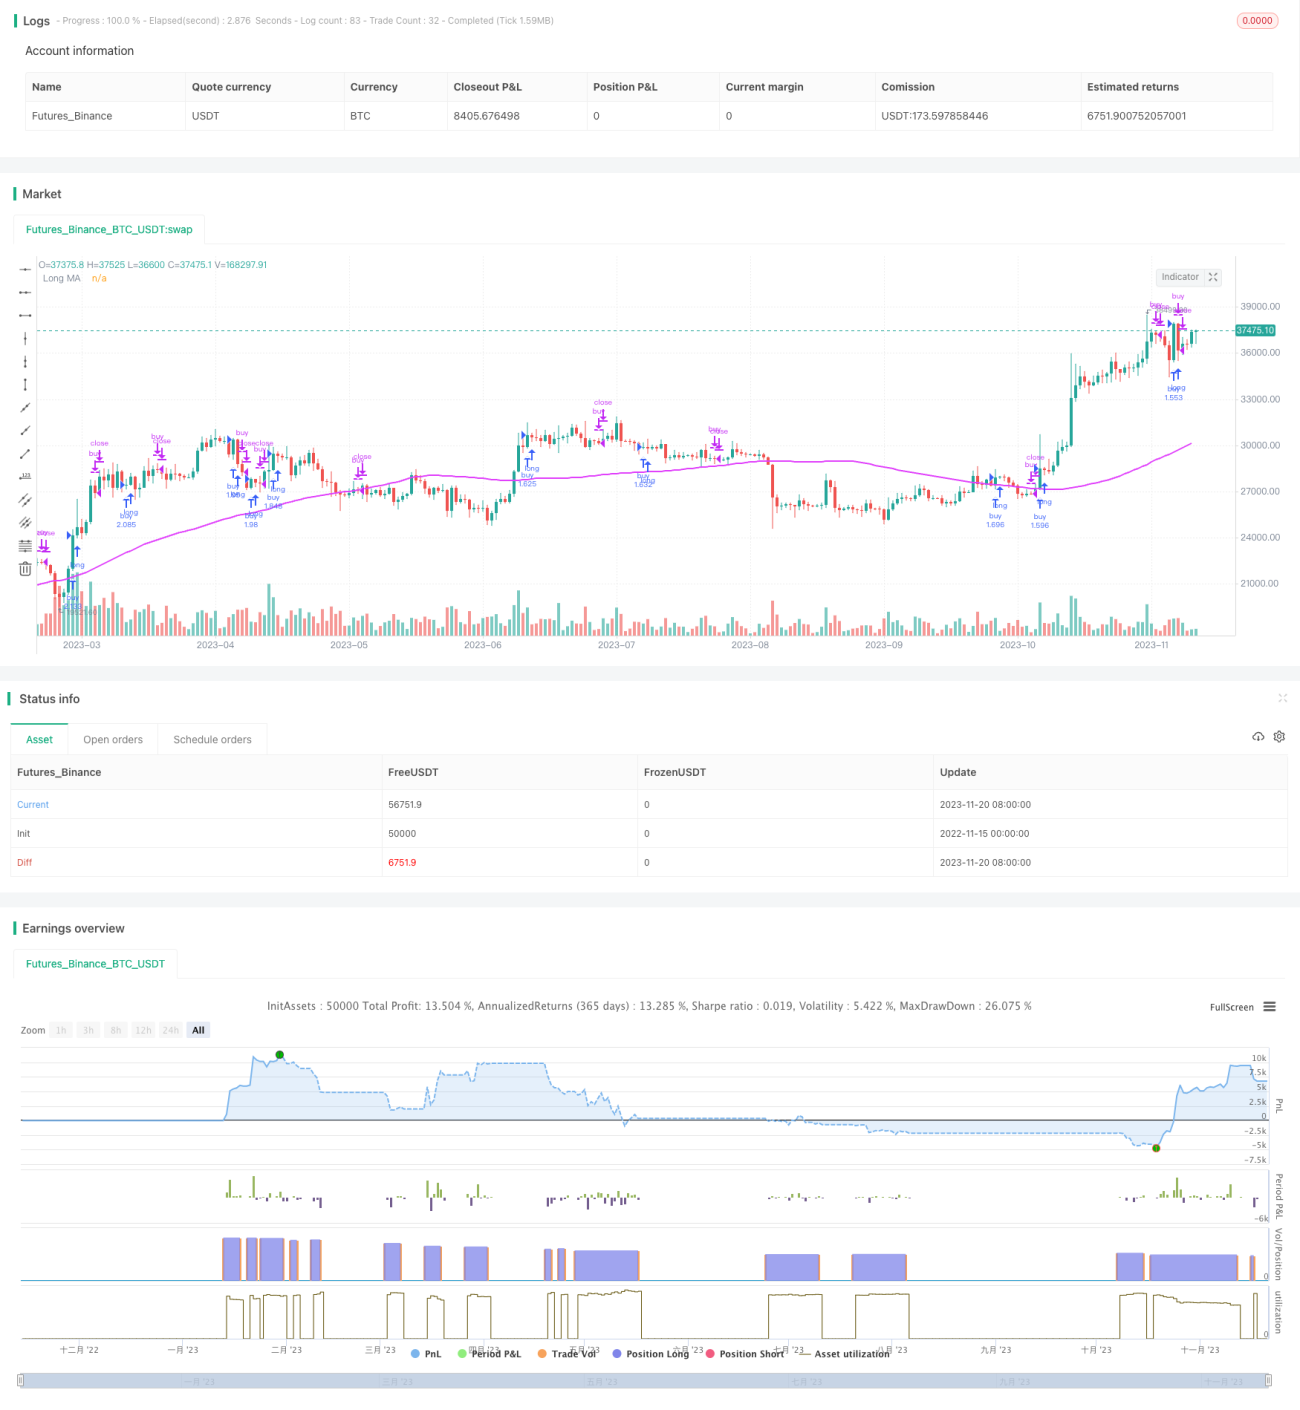
Overview
The main idea of this strategy is to use the crossover of fast and slow moving averages to judge market trends and take positions when short-term and long-term moving averages reverse, so as to achieve the effect of tracking trends.
Strategy Logic
- Set short-term moving average period shortma (default 7 days) and long-term moving average period longma (default 77 days)
- When the short MA crosses over the long MA, it is determined as a buy signal and record barssince(mabuy). The long MA implies an uptrend has begun. When the short MA crosses below the long MA, it is determined as a sell signal and record barssince(masell). The long MA implies the uptrend has ended.
- Compare the barssince values. The more bars since the short MA crossed down, the longer the uptrend has persisted. The more bars since the short MA crossed up, the stronger the reversal signal.
- When barssince for the sell signal is greater than barssince for the buy signal, a buy signal is triggered. When barssince for the buy signal is greater than barssince for the sell signal, a sell signal is triggered.
- Essentially this is a dual MA reversal strategy, using crossover reversals of fast and slow MAs to detect trend reversal points.
Advantages
- Uses dual MAs to filter some false signals
- Added barssince comparision avoids false breaks and close price reversals
- Easy to understand and implement
- Customizable MA parameters suit different periods and markets
Risks
- Dual MA strategies tend to produce more frequent trading signals
- Poor MA parameter tuning may miss longer trends
- Stop loss when breaking long term MAs may be distant, leading to larger drawdowns
- Cannot effectively filter out coils and oscillations
Enhancement Directions
- Add other indicators to avoid whipsaws in ranging markets
- Add stop loss mechanisms
- Optimize MA parameter combinations
- Dynamically tune MA parameters based on market cycle
Summary
The strategy overall has clear, easy to understand logic, using fast and slow MA reversals to detect trend reversal points. In theory it can effectively track trends. But in actual implementation it still needs optimization of the algorithm itself and tuning of parameters to make it more robust and practical.
Source
Pine
/*backtest
start: 2022-11-15 00:00:00
end: 2023-11-21 00:00:00
period: 1d
basePeriod: 1h
exchanges: [{"eid":"Futures_Binance","currency":"BTC_USDT"}]
*/

//@version=3
strategy("Up Down", "Up Down", precision = 6, pyramiding = 1, default_qty_type = strategy.percent_of_equity, default_qty_value = 99, commission_type = strategy.commission.percent, commission_value = 0.0, initial_capital = 1000, overlay = true)

buy = close > open and open > close[1]Strategy parameters
Related strategies
Comment
All comments (0)
No data
- 1