Quantitative Golden Cross Strategy

Overview
This strategy calculates a custom net volume indicator to implement a trading strategy of buying on golden crossover and selling on death crossover. This strategy belongs to the trend following strategy.
Strategy Principle
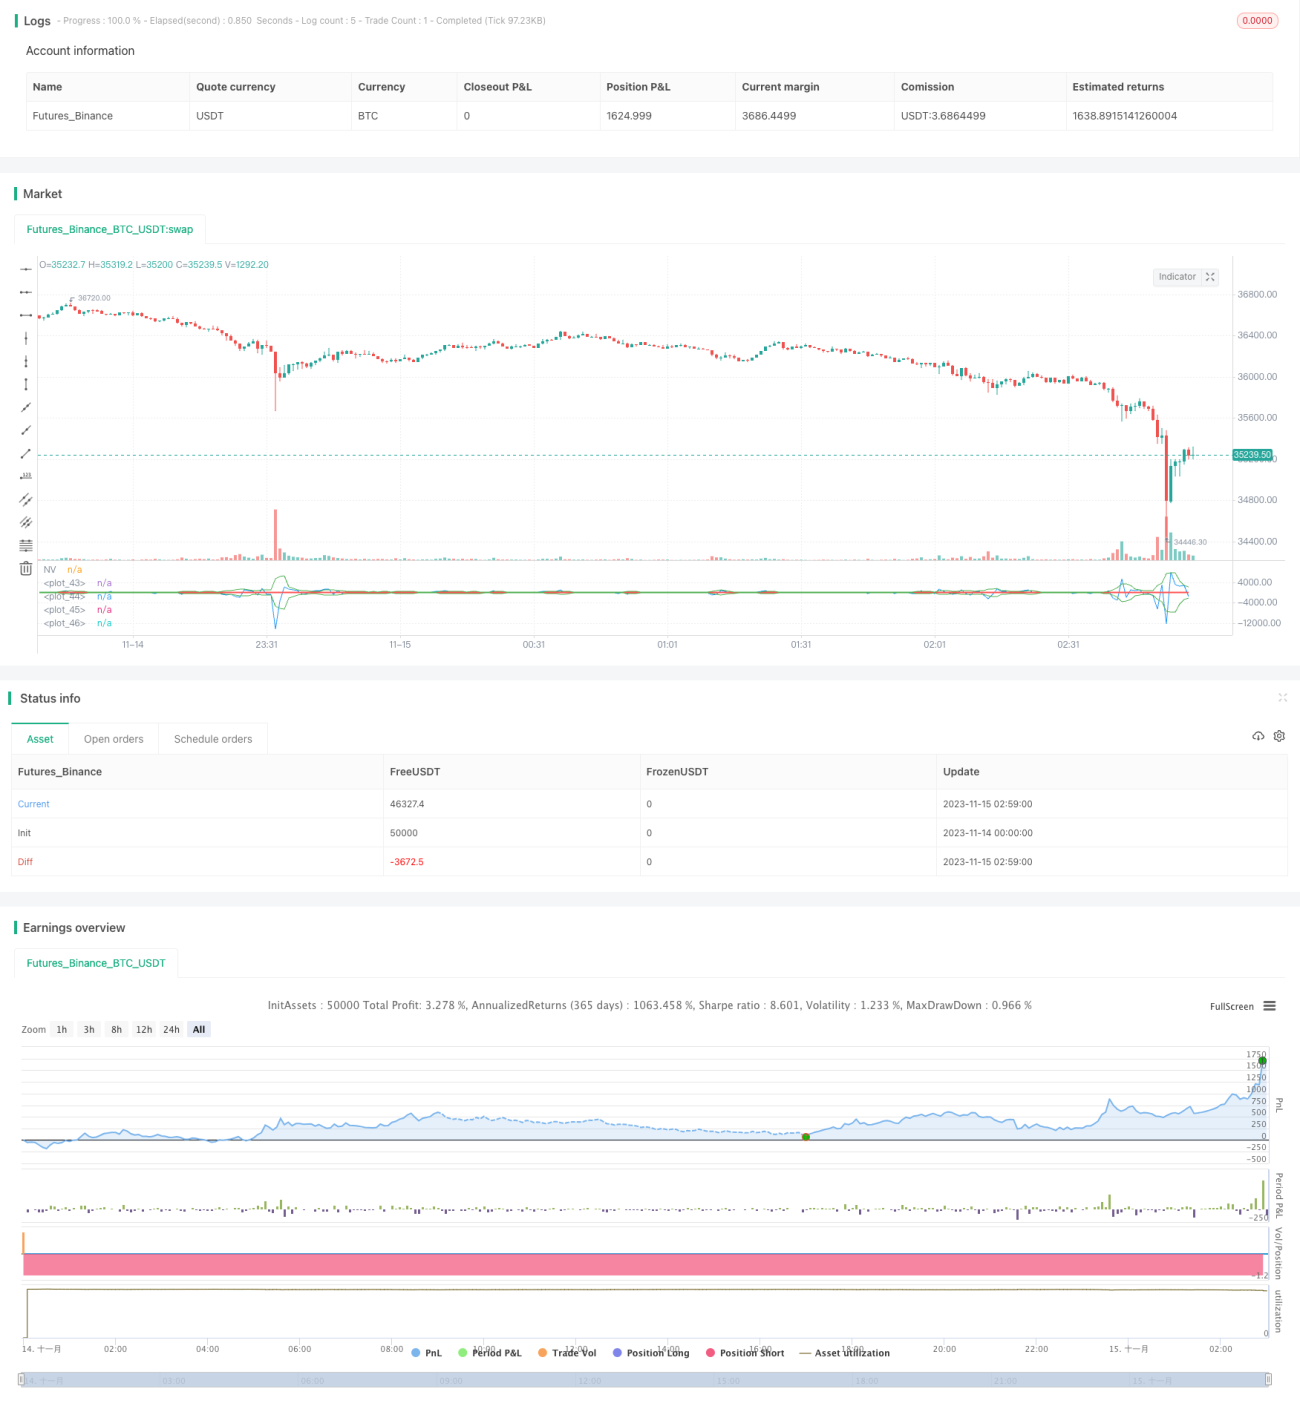
The core logic of the strategy is to calculate a custom net volume (NV) indicator. The NV indicator judges the direction of price changes. If positive, it takes the daily volume. If negative, it takes the negative value of the daily volume. If unchanged, it takes 0. This can more clearly reflect the relationship between price changes and volume.
The strategy then calculates the 3-day simple moving average line of the NV indicator, respectively, as the golden cross line and death cross line. When the NV indicator breaks through the golden cross line from bottom to top, go long. When NV breaks through the death cross line from top to bottom, go short.
In addition, the strategy also sets parameterized start and end times to control trading hours.
Advantages of Strategy
The biggest advantage of this strategy is that the strategy is simple and clear, easy to understand, flexible parameter settings, customizable trading varieties, trading hours, etc. In addition, this strategy belongs to a trend-following strategy that can effectively capture price trends, reduce trading frequency, and achieve higher returns.
Risks of Strategy
The main risks of this strategy are:
-
The daily following strategy cannot respond promptly to changes in price trends. It may miss some trading opportunities or fail to stop losses in time.
-
The quantitative golden cross itself has certain hysteresis, which may lead to late entry and amplified losses.
-
Unable to effectively filter out market noise and susceptible to traps.
Moving averages can be used dynamically, combined with other indicators to reduce risks.
Optimization Directions
The strategy can be optimized in the following aspects:
-
Increase stop loss strategies to control single loss with moving stop loss, overnight stop loss methods.
-
Increase filtering indicators and use MACD, KDJ and other indicators to filter false signals and improve strategy stability.
-
Parameter optimization, iterative search for the optimal parameter combination through genetic algorithms, Markov chains and other methods.
-
Strategy portfolio can be combined with other unrelated strategies to further diversify risks and increase overall returns.
Conclusion
This strategy implements simple and effective trend following through quantitative golden crosses. Although there is a certain degree of hysteresis, the parameter settings are flexible and easy to understand. It is a strategy suitable for beginners to practice. Through continuous optimization, the strategy effect can be gradually improved and risks reduced.
/*backtest
start: 2023-11-14 00:00:00
end: 2023-11-15 03:00:00
period: 1m
basePeriod: 1m
exchanges: [{"eid":"Futures_Binance","currency":"BTC_USDT"}]
*/

//@version=3
strategy(title="@DankCoins - Customized Net Volume")
src = input(defval = close, title = "VA Source")
nv = change(src) > 0 ? volume : change(src) < 0 ? -volume : 0*volume- 1