Dual Trend Lines Intelligent Tracking BTC Investment Strategy

Overview
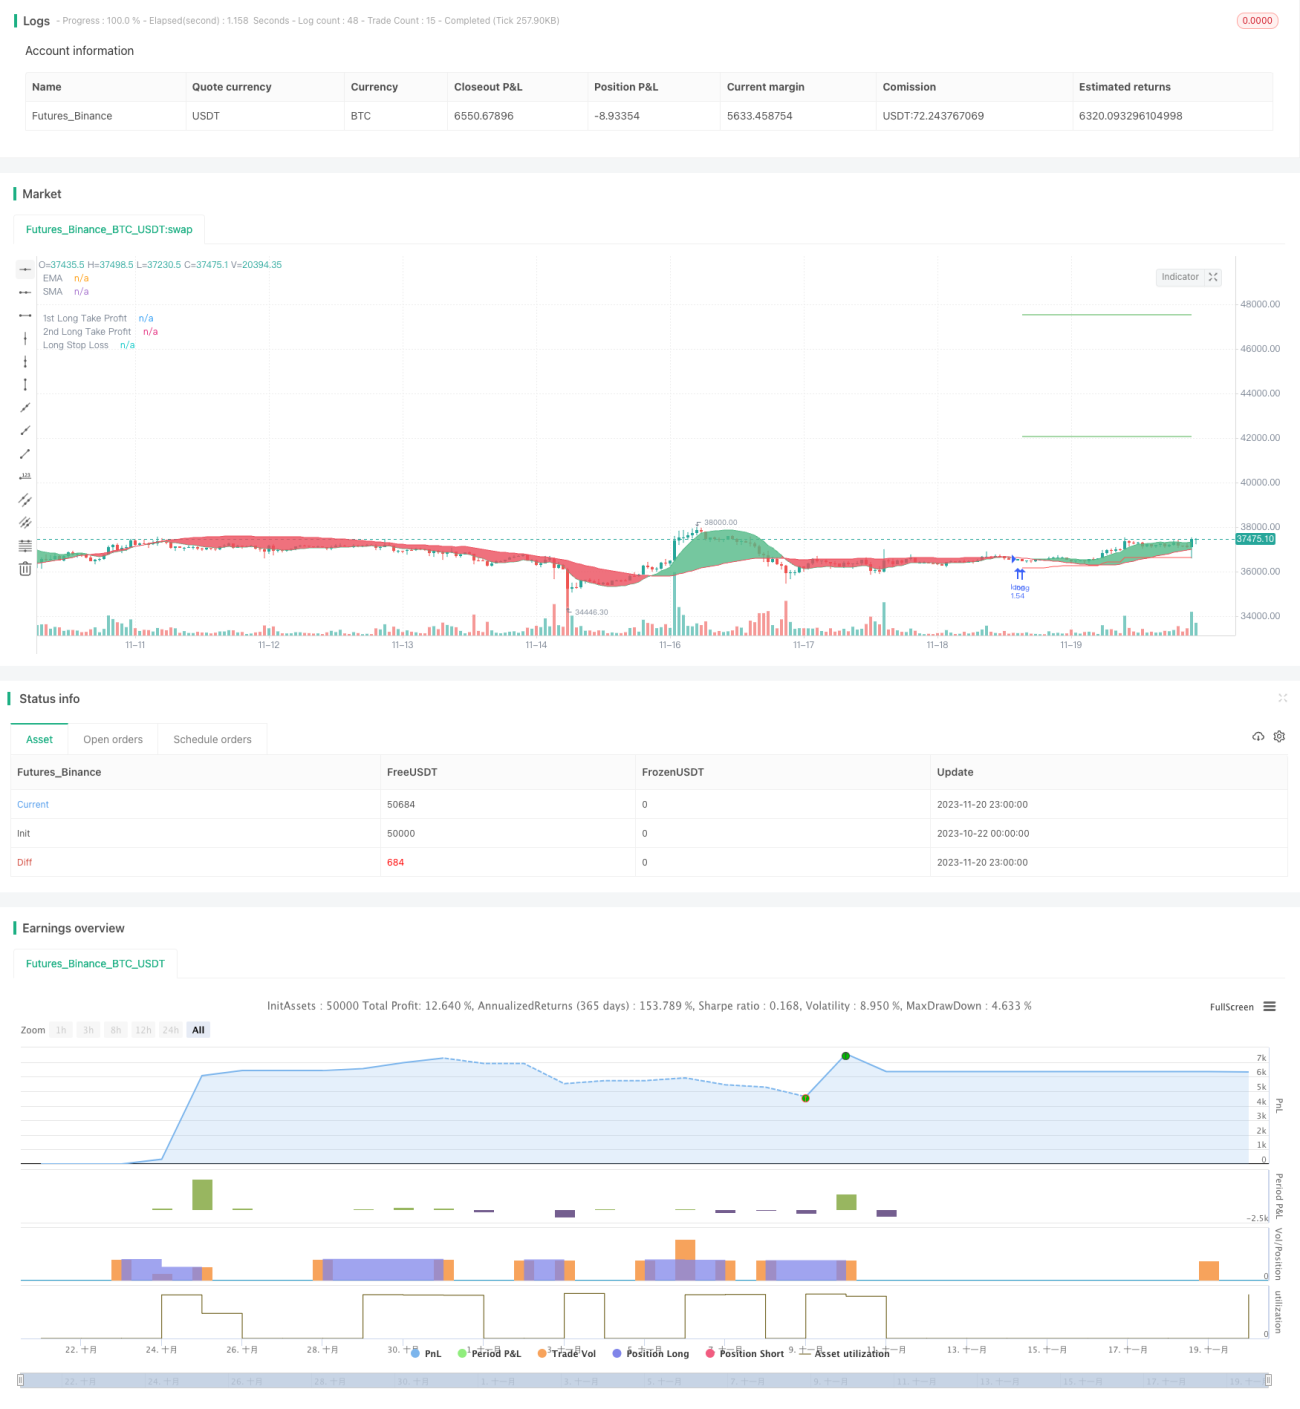
This strategy is mainly used for the automated long-term investment in BTC. It uses the crossover of dual EMA and LSMA to determine the trend direction and uses the ATR indicator to calculate a dynamic stop loss to effectively track the BTC bullish trend.
Strategy Logic
-
Use 25-period EMA and 100-period LSMA to form a dual moving average. Their crossover is used to determine the market trend. The EMA responds quickly to price changes while the LSMA filters out false breakouts.
-
When the fast EMA crosses above the slow LSMA, it is determined that the uptrend is still intact and long positions are taken. On the contrary, when the fast EMA crosses below the slow LSMA, it is determined that a downtrend has begun and existing positions are closed.
-
After taking long positions, the dynamic stop loss calculated using the ATR indicator keeps adjusting to effectively track the uptrend of BTC. Specifically, the initial point of the stop loss line is the entry price. After that, each adjustment will slide up by a fixed percentage of the ATR amplitude.
-
The stop loss line can effectively lock in the floating profit brought by the BTC uptrend, while preventing the stop loss point from getting too close to the latest price to avoid frequent stop loss. In addition, the strategy also sets two moving stop profits of different proportions to lock in more profits.
Advantage Analysis
-
Using dual moving averages to determine the trend is more reliable and can effectively prevent false signals.
-
The ATR dynamic trailing stop loss can lock in most profits while avoiding frequent small stop losses.
-
No matter whether the bullish trend ends or not, as long as the moving average issues an exit signal, the position will be stopped out to control risks.
-
The strategy has a high degree of automation without manual intervention, making it suitable for long-term live trading.
Risk Analysis
-
Still need to pay attention to sudden major news to avoid huge slippage losses.
-
Although the combination of dual moving averages can reduce false signals, it is still difficult to completely avoid them in range-bound markets.
-
Improper parameter settings of ATR can also affect the stop loss effect. Adjustments are needed based on different products.
-
Unreasonable moving average periods or failure to update them in time can lead to signal lag.
-
Ensure server stability to avoid abnormal crashes that interrupt automated trading.
Optimization Directions
-
More indicators such as Bollinger Bands can be added to determine the trend. Machine learning models can also be used to predict prices.
-
The calculation method of the ATR dynamic stop loss can also be adjusted and optimized to make the stop loss smoother.
-
Trading volume based alert mechanisms and intraday rotation features can be added to guard against impacts from major news.
-
Parameters vary for different coins. More historical data can be used to train personalized parameters.
Summary
Overall, this is a very practical automated BTC investment program. Using dual EMAs to determine the major trend is very reliable. With ATR trailing stop loss, it can achieve decent profits and the validity period can be very long. As parameters continue to be optimized, there is still much room for improvement in the performance of this strategy. It is well worth live trading verification.
// This source code is subject to the terms of the Mozilla Public License 2.0 at https://mozilla.org/MPL/2.0/
// © Wunderbit Trading

//@version=4
strategy("Automated Bitcoin (BTC) Investment Strategy", overlay=true, initial_capital=5000,pyramiding = 0, currency="USD", default_qty_type=strategy.percent_of_equity, default_qty_value=100,  commission_type=strategy.commission.percent,commission_value=0.1)

////////////  Functions

Atr(p) =>
    atr = 0.
    Tr = max(high - low, max(abs(high - close[1]), abs(low - close[1])))
atr := nz(atr[1] + (Tr - atr[1])/p,Tr)- 1