Dual-track System Momentum Trading Strategy

[trans]
概述
本策略采用MACD和Stoch RSI两种指标进行组合,构建双轨交易系统,实现趋势跟踪和超跌超买判断。策略同时在日线和4小时线构建指标,实现多时间框架的判断,降低误判概率。
策略原理
策略组合运用MACD和Stoch RSI两种不同类型的技术指标,进行配置。MACD为差动指标,判断价格变化速度;Stoch RSI为超买超卖指标,判断价格相对强弱。
策略首先在日线和4小时线分别构建MACD和Stoch RSI指标,进行趋势和超买超卖判断。当两时间周期的指标同时发出买入/卖出信号时,进行对应的买入/卖出操作。
具体来说,构建MACD指标,DIF线和DEA线构成金叉死叉进行判断;构建Stoch RSI指标,K线和D线构成金叉死叉进行判断。当两组指标同时金叉时产生买入信号,同时死叉时产生卖出信号。
这样,策略综合运用双轨指标和多时间框架判断,对价格变化速度和相对强弱进行全面判断,有助于提高决策准确性,获取更佳回报。
优势分析
本策略具有以下几点优势:
- 组合双轨指标,进行全面判断,提高决策准确性
- 运用多时间框架,降低误判概率
- 采用趋势跟踪和超买超卖判断,综合考量价格变化速度和相对强弱
- 指标参数可调整,适应不同品种和市场环境
- 代码结构清晰,易于理解和拓展
风险分析
本策略也存在一些风险:
- 市场存在系统性风险,无法完全规避
- 指标参数设置不当可能导致交易频繁或错过良机
- 双轨指标同时发出错误信号的概率存在,但低于单一指标
- 无法应对急剧变化的市场,如重大黑天鹅事件
对策:
- 优化参数,调整买卖交易条件,降低误判
- 结合更多指标进行组合,增加判断依据
- 增加止损策略,控制单次亏损风险
优化方向
本策略还可从以下几个方面进行优化:
- 增加更多指标进行组合,构建多指标策略
- 增加机器学习算法,实现动态参数优化
- 结合情绪指标、消息面等更多因素判断市场状况
- 增加止损、止盈策略,优化资金管理
- 扩展更多交易品种,寻找更佳交易机会
总结
本策略通过双轨指标和多时间框架判断的组合运用,对价格变化速度和相对强弱进行全面判断,可以有效获取市场趋势,改进单一指标的误判缺陷。同时也具有参数调整灵活、易于理解与扩展等优点。后续可通过多指标组合、动态参数优化、情绪指标引入等方式进行拓展与优化,进一步提高策略绩效。
||
Overview
This strategy combines the MACD and Stoch RSI indicators to build a dual-rail trading system for trend tracking and oversold/overbought judgment. The strategy also builds indicators on the daily and 4-hour timeframes to make multi-timeframe judgments to reduce misjudgment probability.
Strategy Principle
The strategy combines the MACD and Stoch RSI indicators, which are different types of technical indicators, for configuration. MACD is a momentum indicator that judges price change velocity; Stoch RSI is an overbought/oversold indicator that judges relative price strength.
The strategy first constructs the MACD and Stoch RSI indicators on the daily and 4-hour timeframes respectively for trend and overbought/oversold judgments. When signals are triggered on both timeframes, corresponding buy/sell operations are performed.
Specifically, the MACD indicator is constructed with the DIF and DEA lines forming golden/dead crosses for judgment; the Stoch RSI indicator is constructed with the K and D lines forming golden/dead crosses for judgment. When both indicator pairs have golden crosses, buy signals are generated; when both have dead crosses, sell signals are generated.
Thus, by comprehensively applying the dual-indicator system and multi-timeframe judgments, the strategy judges price velocity and relative strength thoroughly, which helps improve decision accuracy and gain better returns.
Advantage Analysis
This strategy has the following advantages:
- Combining dual-indicator system for comprehensive judgment and higher decision accuracy
- Applying multi-timeframe to reduce misjudgment probability
- Adopting trend tracking and overbought/oversold judgment for consideration of both price velocity and relative strength
- Flexible indicator parameters adjustable for different products and market environments
- Clean code structure easy to understand and expand
Risk Analysis
There are also some risks with this strategy:
- There exist systemic market risks that cannot be fully avoided
- Inappropriate indicator parameter settings may lead to overtrading or missing opportunities
- Dual indicators may still give concurrent wrong signals, but less likely than single ones
- Unable to cope with drastic market changes like black swan events
Countermeasures:
- Optimize parameters and adjust trading conditions to reduce misjudgments
- Incorporate more indicators for combined judgments
- Add stop loss mechanisms to control single loss risk
Optimization Directions
This strategy can also be improved in the following aspects:
- Incorporate more indicators for multi-indicator strategies
- Add machine learning algorithms for dynamic parameter optimization
- Combine sentiment indicators, news etc. for more comprehensive market condition judgments
- Add stop loss, take profit strategies to optimize money management
- Expand to more trading products to discover better opportunities
Conclusion
By combined application of the dual-indicator system and multi-timeframe judgments, this strategy judges price velocity and relative strength thoroughly, which can effectively capture market trends and improve deficiencies of single indicators. It also has advantages like flexible parameter tuning, easy understanding and expansion. Further expansions by multi-indicator combination, dynamic parameter optimization, sentiment indicator incorporation etc. can help boost strategy performance.
[trans]
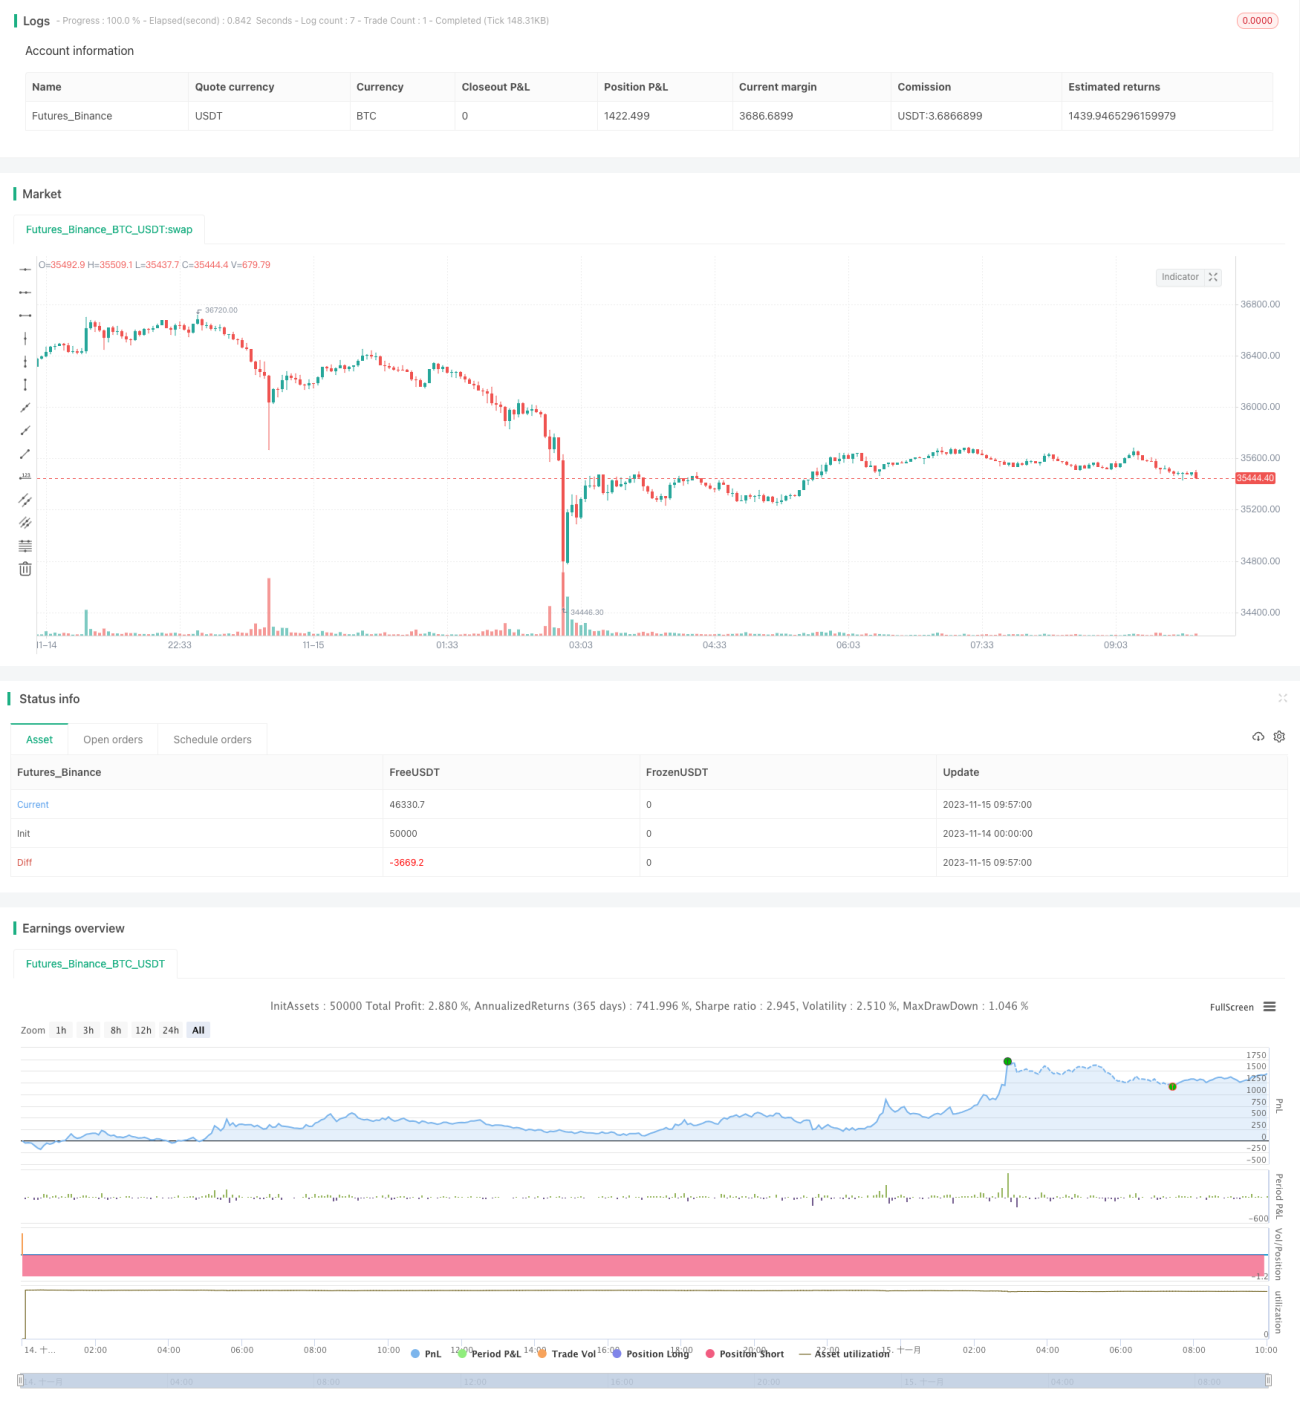
/*backtest
start: 2023-11-14 00:00:00
end: 2023-11-15 10:00:00
period: 3m
basePeriod: 1m
exchanges: [{"eid":"Futures_Binance","currency":"BTC_USDT"}]
*/

//@version=2
strategy(title='[RS]Khizon (UWTI) Strategy V0', shorttitle='K', overlay=false, pyramiding=0, initial_capital=100000, currency=currency.USD)
//  ||  Inputs:
macd_src = input(title='MACD Source:', defval=close)- 1