Trend Following Strategy Based on Trend Confidence

Overview
The main idea of this strategy is to implement a trend following strategy that is as precise as possible. It judges the continuity possibility of the current linear trend by calculating the "confidence" of a certain number of past closing prices. The strategy assumes that once the confidence exceeds a certain level, the ongoing linear trend is more likely to continue.
Strategy Principle
The strategy calculates the linear fit of the past N closing prices using ordinary linear regression, obtaining the slope k and standard deviation σ of the deviation from the closing prices. Then the trend confidence is defined as k/σ.
When the trend confidence exceeds the "long entry" threshold, go long; when it drops to the "long exit" threshold, close long. Similarly, when the trend confidence is below the "short entry" threshold, go short; when it exceeds the "short exit" threshold, close short.
This way it can filter out signals from wild price moves that do not follow a clear linear trend.
Advantage Analysis
The strategy combines trend following and linear regression methods in statistics, which can avoid following short-term price fluctuations and only follow long-term trends, thus obtaining lower trading frequency and higher win rate.
The strategy has large parameter tuning space and can be adapted to different products and timeframes by adjusting parameters, achieving good generalizability.
Risk Analysis
The strategy has the risk of being trapped. It will generate large losses when significant trend reversal occurs. In addition, improper parameter settings can also lead to overtrading or missing good trading opportunities.
Stop loss can be set to control downside risk. At the same time, the choice of parameters must be evaluated carefully to avoid overfitting.
Optimization Directions
The strategy can be further optimized in the following aspects:
-
Add stop loss/take profit logic to lock in profits and control risks
-
Add adaptive optimization module for dynamic parameter adjustment
-
Add machine learning model to determine trend reversal points and further improve win rate
-
Test adaptability on different products and timeframes to improve generalization
Conclusion
In general, this is a long-term trend following strategy with risk control. It combines trend following and linear regression methods to filter out noise trading signals. Through parameter tuning, it can adapt well to different products and timeframes, and is an effective strategy worth in-depth research and improvement.
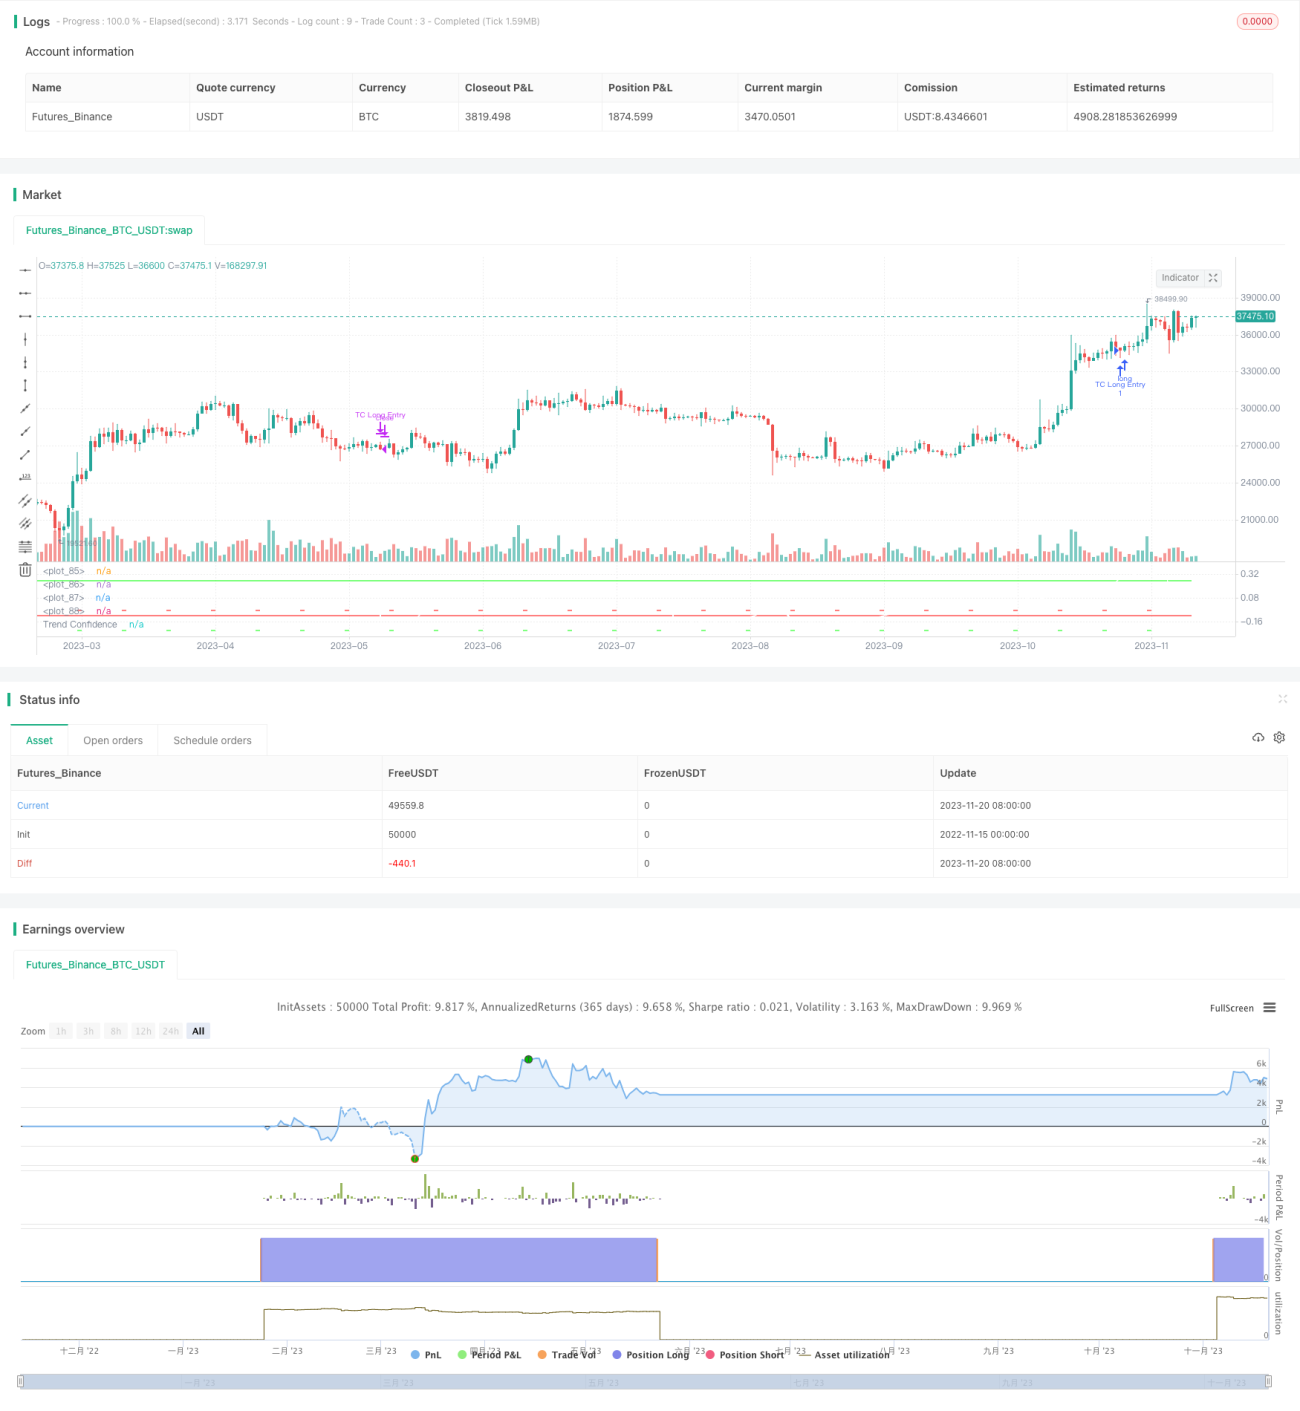
/*backtest
start: 2022-11-15 00:00:00
end: 2023-11-21 00:00:00
period: 1d
basePeriod: 1h
exchanges: [{"eid":"Futures_Binance","currency":"BTC_USDT"}]
*/

// This source code is subject to the terms of the Mozilla Public License 2.0 at https://mozilla.org/MPL/2.0/
// © carefulCamel61097

// ################################################################################################- 1