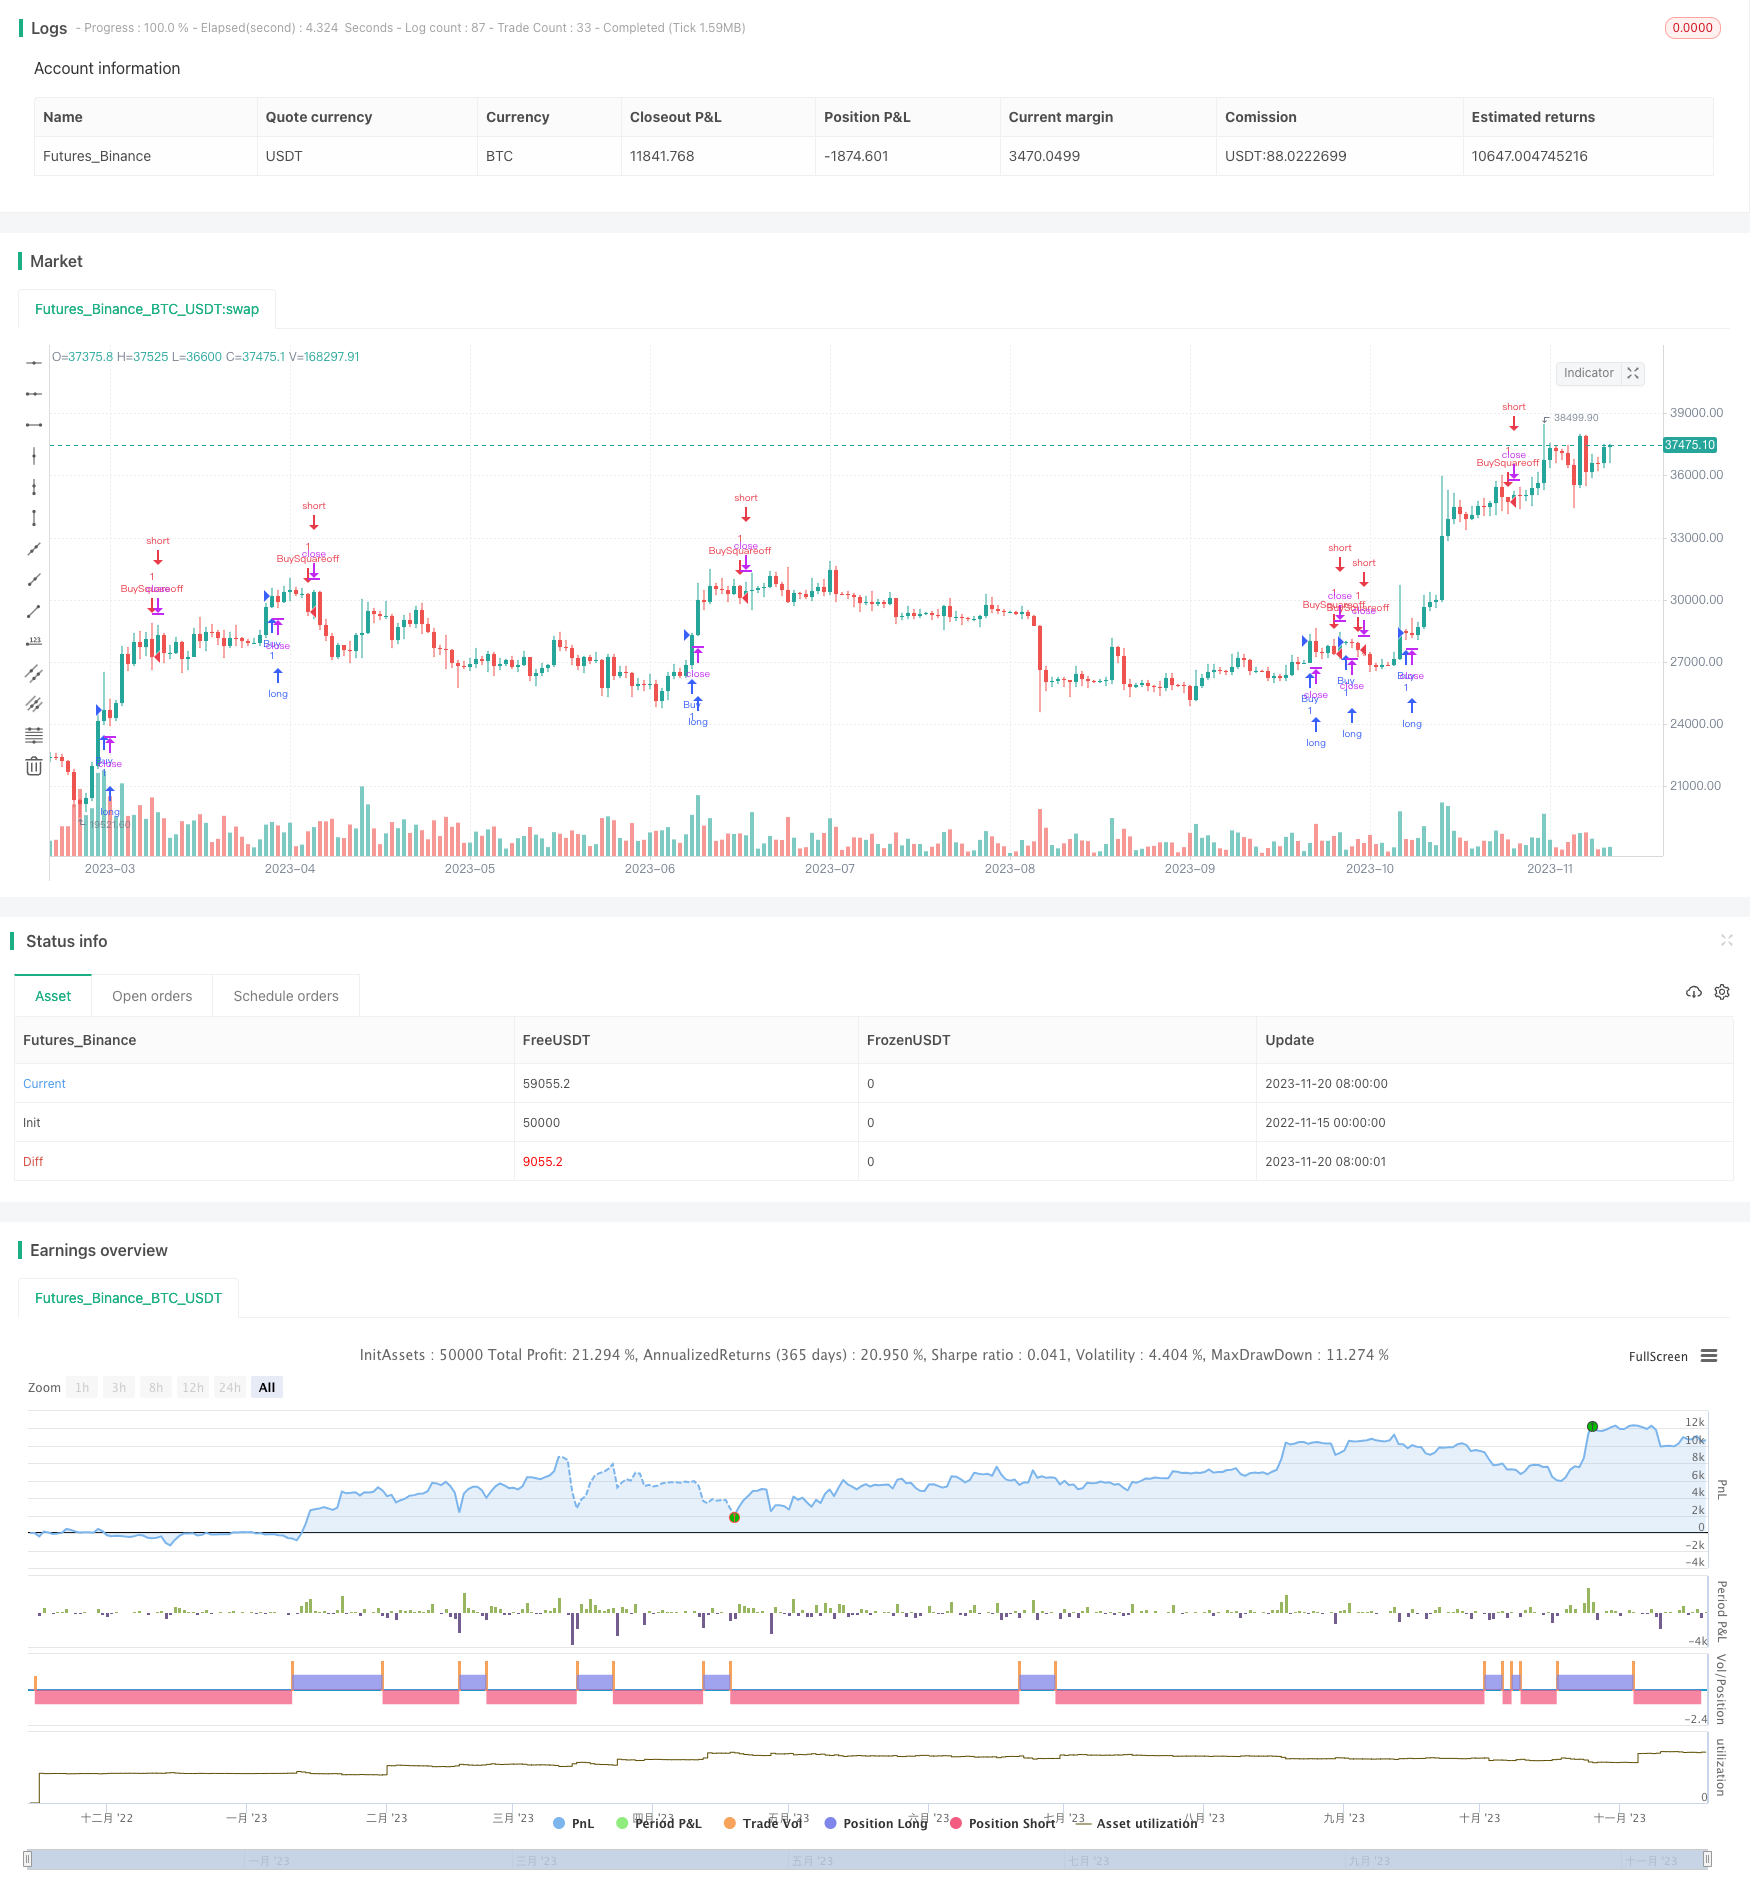
概述
这个策略综合考虑多种技术指标,在判断市场有较强的多头动量时,进行买入操作。具体来说,策略会同时考虑MACD、RSI、ADX、Stochastic和布林带这5个指标,当这些指标同时符合多头条件时生成买入信号。
策略原理
这个策略的核心逻辑是在判断市场有较强的多头动能后买入。具体判断规则如下:
- 5分钟、15分钟和60分钟MACD的当前柱体都上涨
- RSI大于60
- ADX大于12
- Stochastic %K线上穿%D线
- 布林带上轨上涨
当上述5个条件同时成立时,认为市场多头动能较强,この时进行买入操作。
交易退出规则为5分钟收盘价下破5分钟EMA时退出当前仓位。
优势分析
这个策略有以下几个优势:
- 综合多个指标,判断市场总体多头趋势,避免被单一指标误导
- 利用高低时间轴指标组合,判断市场多头动量的持续性
- 退出机制严格,避免亏损扩大
- 交易频率适中,不会过于密集交易
总的来说,这个策略判断准确,风险控制得当,适合捕捉短线多头行情。
风险分析
该策略也存在一些风险:
- 多个指标组合判断,增加了汇入场错误的概率
- 退出机制可能过于严格,可能会过早退出正确的交易
- 交易频率较高,过于频繁交易会增加手续费负担
总体来说,这个策略的风险主要在汇入场错误和过早退出上,这需要通过参数优化和规则调整来减轻。
优化方向
对这个策略可以从以下几个方向进行优化:
- 优化MACD参数,找到更加符合市场规律的参数组合
- 调整RSI参数,寻找更好的超买超卖区间
- 优化Stochastic的参数,找到更好的交叉组合
- 调整布林带参数,使布林带更好反映市场波动性
- 优化或替换退出机制规则,降低错误退出概率
通过参数和规则优化,能够进一步提升这个策略的盈利水平和风险控制能力。
总结
这个策略综合考虑多种指标判断市场多头趋势, exit机制较为严格。策略判断准确,能捕捉短线行情,风险控制也较好。通过持续优化参数和交易规则,能进一步增强策略的效果。总体而言,该策略具有较强的实用性。
策略源码
/*backtest
start: 2022-11-15 00:00:00
end: 2023-11-21 00:00:00
period: 1d
basePeriod: 1h
exchanges: [{"eid":"Futures_Binance","currency":"BTC_USDT"}]
*/

// This source code is subject to the terms of the Mozilla Public License 2.0 at https://mozilla.org/MPL/2.0/
// © makarandpatil

// This strategy is for Bank Nifty instrument and for intraday purpose only
// It checks for various indicators and gives a buy signal when all conditions are met
// Bank Nifty when in momentum gives 100-200 points in spot in 5-15 min which is how long the trade duration should be
// Issues - The custom script as per TradingView Pinescripting has an issue of repaint
// More information on repainting issue in this link - https://www.tradingview.com/pine-script-docs/en/v5/concepts/Repainting.html
// Use the script alert only to get notified, however check all the parameters individually before taking the trade
// Also, please perform a backtesting and deep backtesting of this strategy to see if the strategy gave correct buy signals in the past
// The script is made for testing purposes only and is in beta mode. Please use at own risk.

//@version=5
strategy("BankNifty_Bullish_Intraday", overlay=true, margin_long = 100, margin_short = 100)

// Variables
StochLength = input(14, title="Stochastic Length")
smoothK = input(3, title="%K Smoothing")
smoothD = input(3, title="%D Smoothing")


//INDICATOR CALCULATIONS

// 1. MACD
[macdLine, signalLine, histLine] = ta.macd(close[0],12,26,9)

macd5 = request.security(syminfo.tickerid, "5", macdLine)
macd15 = request.security(syminfo.tickerid,"15",macdLine)
macd60 = request.security(syminfo.tickerid,"60",macdLine)

// 2. RSI Calculation
xRSI = ta.rsi(close, 14)

// 3. ADX calculation
[diplus, diminus, adx] = ta.dmi(14,14)
// plot(adx,color = color.black)

// 4. Stochastic Calculation
k = ta.sma(ta.stoch(close, high, low, StochLength), smoothK)
d = ta.sma(k, smoothD)

// 5. Bollinger Band calculation
[middle, upper, lower] = ta.bb(close, 20, 2)


//CONDITIONS

// 1. Conditions for MACD
macd5Uptick = macd5[0] > macd5[1]
macd15Uptick = macd15[0] > macd15[1]
macd60Uptick = macd60[0] >= macd60[1]

// 2. Condition for xRSI
RSIStrong = xRSI > 60

// 3. Condition for ADX
ADXUngali = adx >= 12

// 4. Condition for Stochastic
StochPCO = k > d

// 5. Condition for Bollinger Band
BBCU = upper > upper [1]

//Evaluate the long condition
// longCondition = macd5Uptick and macd15Uptick and RSIStrong and ADXUngali and StochPCO and BBCU
longCondition = macd5Uptick and macd15Uptick and macd60Uptick and RSIStrong and ADXUngali and StochPCO and BBCU
// longCondition = macd5Uptick and macd15Uptick and RSIStrong and ADXUngali and StochPCO and BBCU

if (longCondition)
    strategy.entry("Buy", strategy.long,alert_message = "BankNifty_Buy_Momentum")

shortCondition = close < ta.ema(close,5)
if (shortCondition)
    strategy.entry("BuySquareoff", strategy.short, alert_message = "BankNifty_Closed_Below_5EMA")