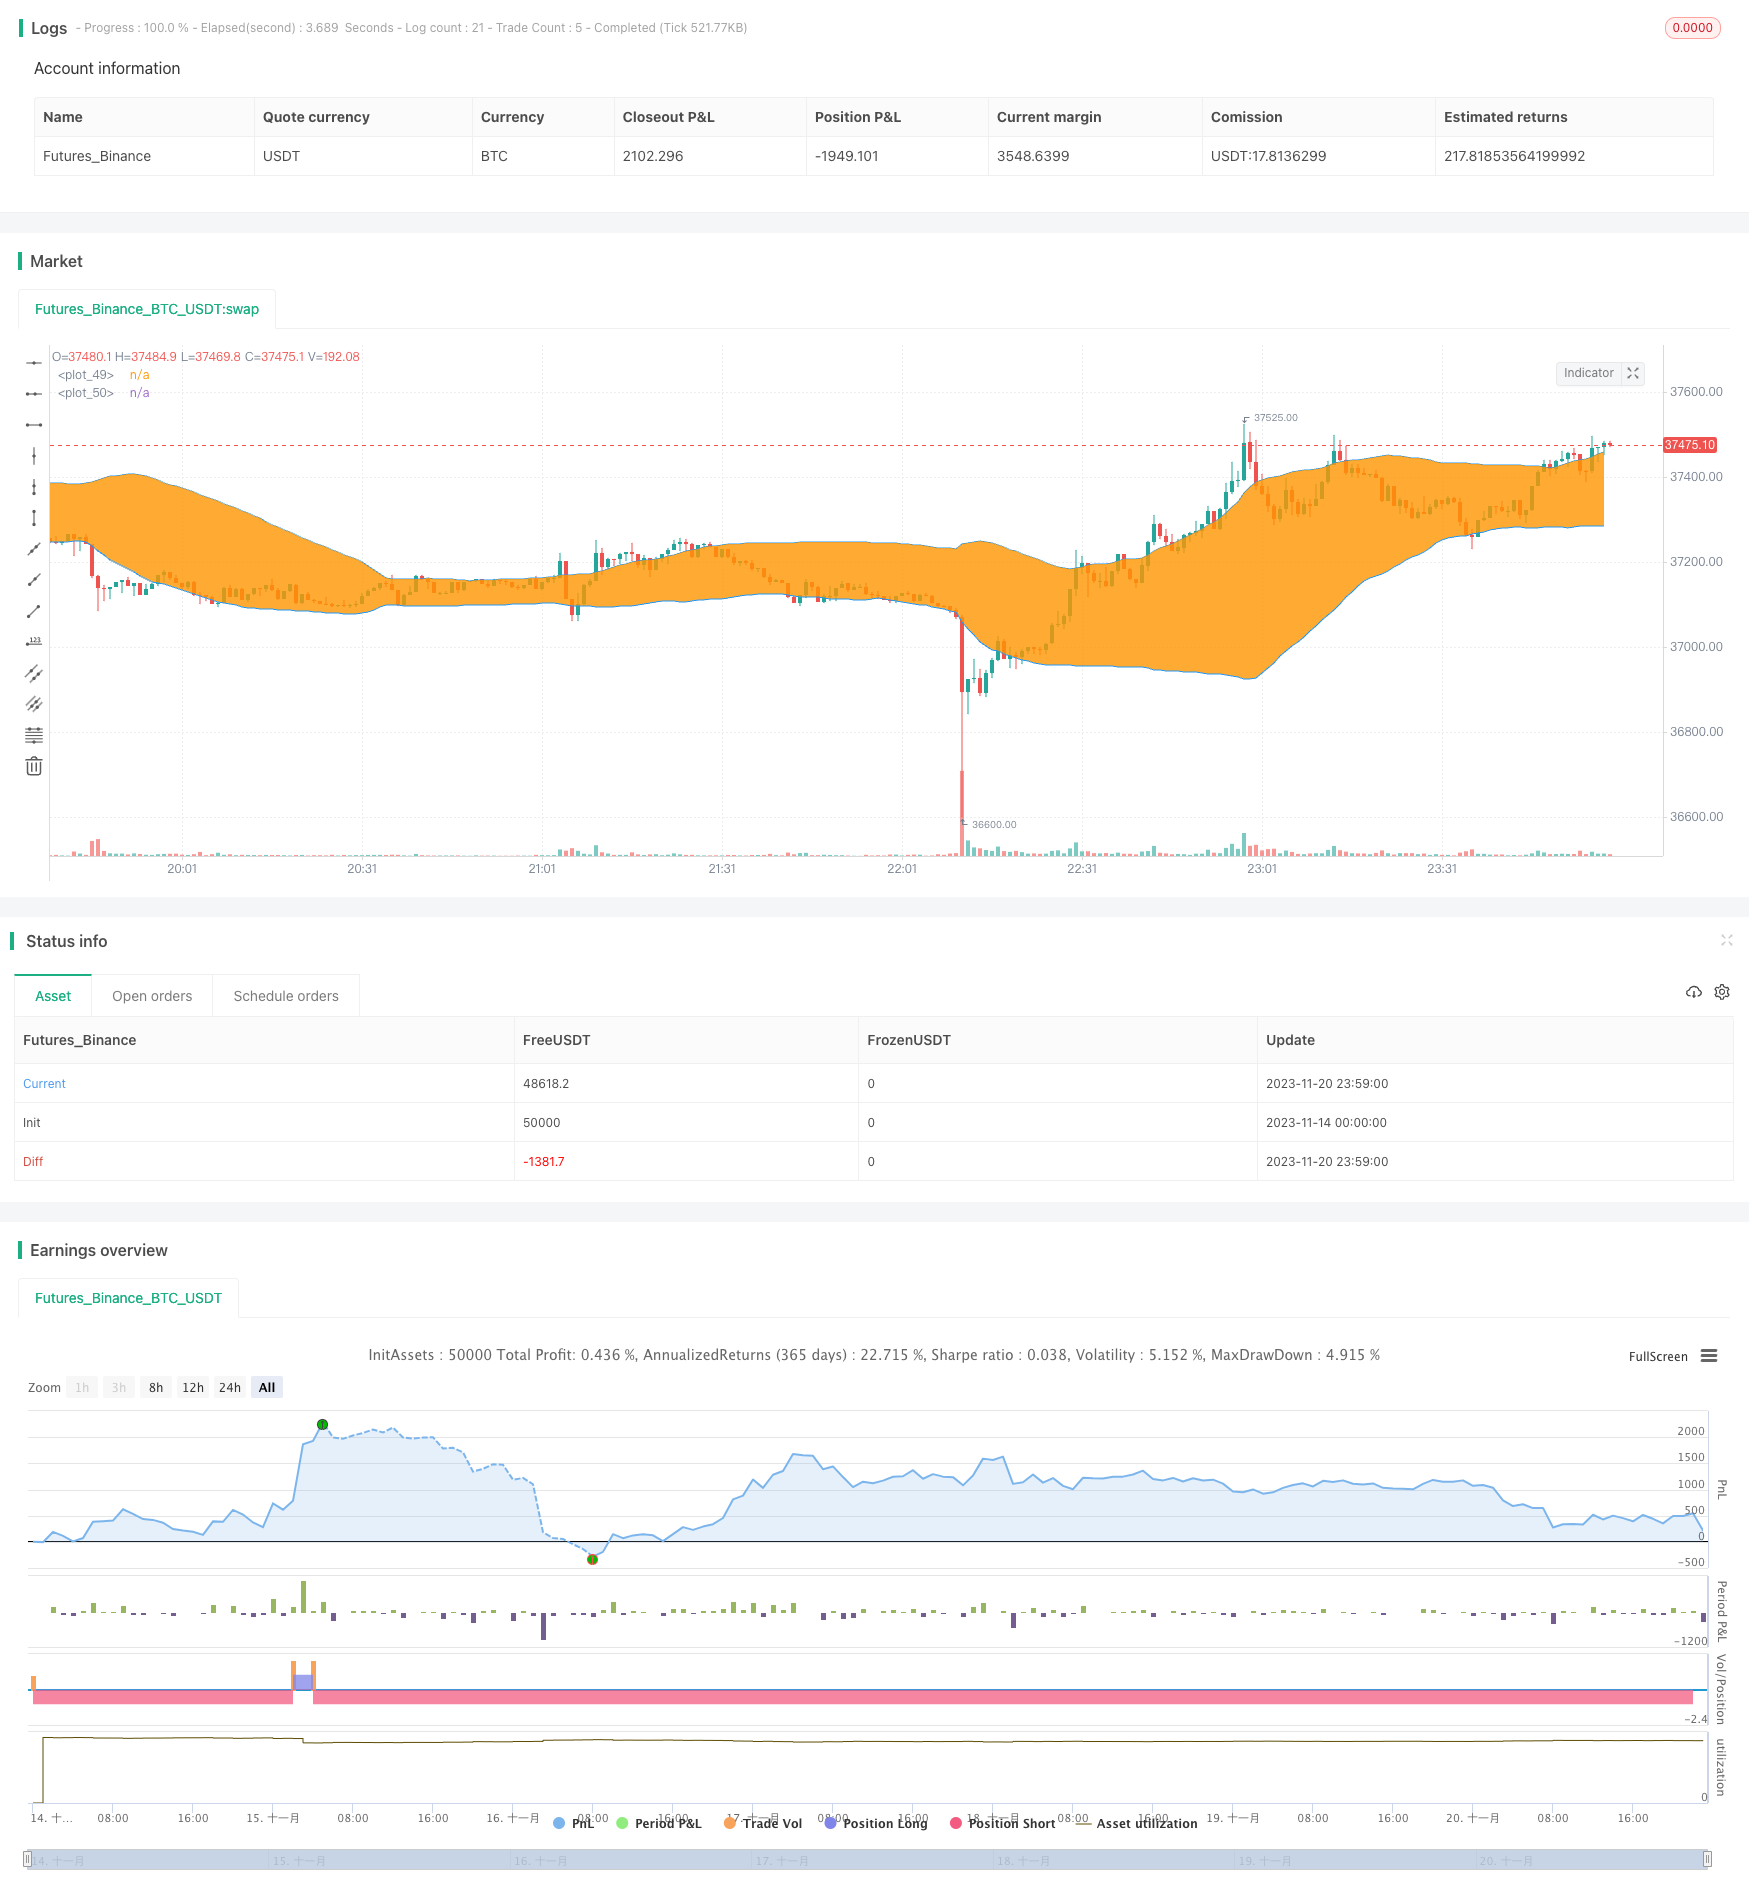
概述
DPD-RSI-BB量化策略是一种同时结合DPD、RSI和布林带三个指标的股票交易策略。该策略利用DPD判断趋势,RSI判断超买超卖,布林带判断支撑压力位进行入场。
策略原理
该策略主要由以下几部分组成:
- DPD指标判断趋势
使用双EMA平均线构建DEMA均线,并计算价格与DEMA的差价比例作为趋势判断指标,当差价比例低于设定阈值时作为看涨信号。
- RSI指标判断超买超卖
计算一定周期内的RSI值,RSI高于设定上限判断为超买区,RSI低于设定下限判断为超卖区。
- 布林带判断支撑压力
计算一定周期的中轨、上轨和下轨,价格接近上轨作为看跌信号,价格接近下轨作为看涨信号。
- 综合判断
当DPD差价比例低于阈值,RSI低于超卖区下限,且价格低于布林带上轨时,产生看涨信号;当RSI高于超买区上限,DPD差价比例高于阈值,且价格高于布林带上轨时,产生看跌信号。
优势分析
该策略具有以下优势:
多指标综合判断,避免单一指标产生的误信号。
利用RSI指标判断超买超卖情况,设置事先止损止盈点。
DPD指标能较好判断价格趋势,布林带能判断支撑压力位。
不同参数的灵活设定,可针对不同股票进行优化。
风险及优化
该策略也存在一些风险:
多指标组合判断会使策略较为复杂,参数设定较难。
DPD、RSI等指标存在一定延迟,可能错过最佳入场时点。
需要优化参数以适应不同周期和股票特性。
可从以下方面进行优化:
调整指标参数,优化入场退出点位。
增加止损机制,严格控制单笔损失。
测试不同股票和周期参数,评估策略效果。
总结
DPD-RSI-BB策略综合多个指标判断,回避单一指标产生的假信号。通过参数优化,可成为一个较强的股票交易策略。但该策略也有可能因复杂度大而难以完全回避市场风险,需谨慎使用。
策略源码
/*backtest
start: 2023-11-14 00:00:00
end: 2023-11-21 00:00:00
period: 1m
basePeriod: 1m
exchanges: [{"eid":"Futures_Binance","currency":"BTC_USDT"}]
*/

//@version= 2
strategy("DPD+RSI+BB ",overlay=true)
price=close


//############### DPD  #################


buyper =input(-1,step=0.1)
sellper=input(0,step=0.1)
demalen = input(50,title="Dema Length")
e1= ema(close,demalen)
e2=ema(e1,demalen)
demaprice  =   2 * e1 - e2
demadifper =  ((price-demaprice)/price)*100


//############## DPD #####################

//############# RSI ####################


lengthrsi = input(6)
overSold = input( 20 )
overBought = input( 60 )

vrsi = rsi(price, lengthrsi)

//########## RSI #######################

//############### BB #################

lengthbb = input(50, minval=1)
multlow = input(1.5, minval=0.001, maxval=50,step=0.1)
multup = input(1.5,minval=0.001,maxval=50,step=0.1)

basisup = sma(close, lengthbb)
basislow = sma(close, lengthbb)

devup = multup * stdev(close, lengthbb)

devlow = multlow*stdev(close,lengthbb)

upperbb = basisup + devup
lowerbb = basislow - devlow

p1 = plot(upperbb, color=blue)
p2 = plot(lowerbb, color=blue)
fill(p1, p2)


//########### BB ###################


yearfrom = input(2018)
yearuntil =input(2039)
monthfrom =input(6)
monthuntil =input(12)
dayfrom=input(1)
dayuntil=input(31)


if (  (demadifper<buyper) and crossover(vrsi,overSold) and  (price < upperbb) and   year >= yearfrom and year <= yearuntil and month>=monthfrom and month <=monthuntil and dayofmonth>=dayfrom and dayofmonth < dayuntil)
    strategy.entry("BUY", strategy.long, stop=close, oca_name="TREND",  comment="BUY")

else
    strategy.cancel(id="BUY")


if (   price>upperbb and vrsi>overBought and demadifper>sellper   and  year >= yearfrom and year <= yearuntil and month>=monthfrom and month <=monthuntil and dayofmonth>=dayfrom and dayofmonth < dayuntil )

    strategy.entry("SELL", strategy.short,stop=close, oca_name="TREND",  comment="SELL")
else
    strategy.cancel(id="SELL")