Kairou Strategy

Overview
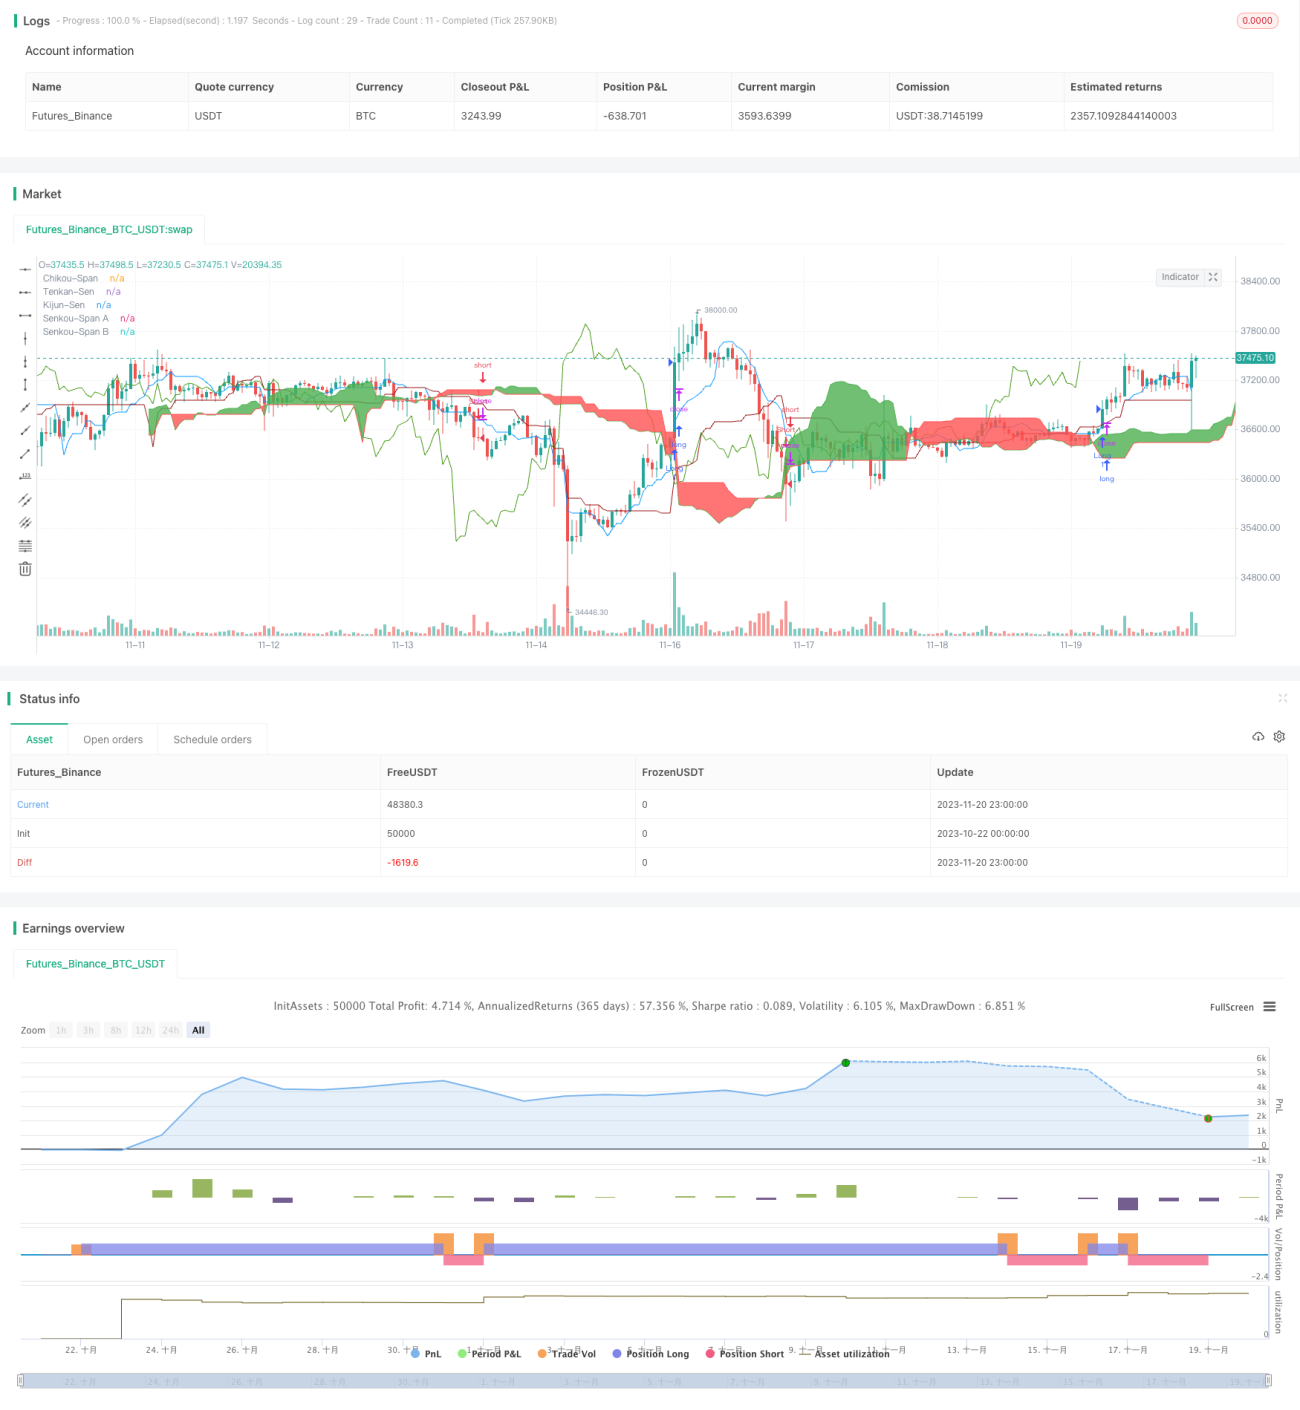
The Kairou strategy is a quantitative trading strategy integrating multiple technical indicators including Ichimoku Cloud, MACD, Chaikin Money Flow (CMF), and True Strength Index (TSI). This strategy aims to discover medium and long-term trading opportunities in the market.
Strategy Logic
The core idea of the Kairou strategy is to combine Ichimoku Cloud’s long/short signals, MACD’s long/short indicators, CMF’s capital flow indicators, and TSI’s strength index to judge the market trend, overbought and oversold areas. Ichimoku Cloud can clearly determine the trend direction and key support/resistance; MACD reflects the contrast of buying/selling power and the overbought/oversold phenomenon; CMF judges capital inflows and outflows; TSI shows the real buying and selling power of the market.
Specifically, the strategy makes judgments mainly based on the following indicators:
- Tenkan line crosses above Kijun line in Ichimoku Cloud indicating a bullish signal
- Chikou Span crossing above 0 indicating confirmation of a bullish signal
- MACD histogram crossing above 0 showing strengthening of buying power
- CMF indicator > 0.1 indicating capital inflow
- TSI indicator > 0 showing stronger buying power than selling power
When the above 5 conditions are met at the same time, a long signal is generated; When conditions such as Tenkan line crossing below Kijun line are reversed, a short signal is generated.
This strategy combines the long and short conditions of multiple indicators to avoid the noise caused by single indicator judgments. At the same time, by using Ichimoku Cloud to determine key support and resistance areas and combining the direction of the shadow of the lagging span to determine the direction of actual capital flow, it is possible to enter at the later stage of the trend and exit at key points before, thereby obtaining greater profits.
Advantages Analysis
The biggest advantage of the Kairou strategy is that it comprehensively uses multiple indicators to judge the overbought/oversold phenomena in the market and accurately determine the buying and selling points. Specific advantages:
-
Improved signal accuracy through multiple indicator integration. A single indicator is prone to false signals while this strategy effectively filters out noise and improves signal reliability by integrating Ichimoku Cloud, MACD, CMF, TSI and more.
-
Identify key support and resistance with Ichimoku Cloud. Ichimoku Cloud clearly displays key support and resistance levels. The strategy can deploy long and short points around these areas to enter the market at later stages of the trend.
-
Determine true capital flow using lagging span. The lagging span shows divergence to spot false moves from arbitrage orders rather than real funds.
-
Display overbought/oversold with MACD. MACD quickly displays overbought/oversold conditions. Together with Ichimoku Cloud levels it accurately determines long and short entry signals.
-
Display capital flow with CMF. The CMF indicator reflects movements of big players through volume changes avoiding misleading signals from arbitrage flows.
-
Show strength of buy/sell forces with TSI. By removing price movement magnitudes, TSI accurately displays the real strength of buying/selling forces to spot bottom bounces and top drops.
Risks and Optimization
Despite its advantages, the Kairou strategy also carries some risks worth noting. The main risks and optimization directions are as follows:
-
Parameter optimization. Existing parameters may not be optimal. More systematic optimization methods can be used to find better parameters for more steady profits.
-
Lack of stop loss mechanism. There is currently no stop loss mechanism. Significant market reversals could lead to uncontrolled losses. Reasonable trailing or limit order stop losses should be implemented.
-
High trading frequency. Multiple integrated indicators may generate excessively high trading frequencies. Parameter tuning should be used to reasonably control number of trades.
-
Performance fluctuations. Interactions between multiple indicators can lead to larger performance fluctuations in certain market conditions. Weighting methods from model combinations could be explored.
-
Signal divergence risks. If indicators show contradicting signals, entry decisions become difficult. Such cases require manual review and analysis.
Conclusion
The Kairou strategy is a multi-indicator quantitative trading strategy. It takes full advantage of the complementary strengths of Ichimoku Cloud, MACD, CMF, TSI and more to uniquely determine entry and exit timing. There is also room for optimizations in aspects like stop loss mechanisms, parameter tuning, weight allocation etc. to significantly enhance the stability of strategy operations.
- 1