Bollinger Band Trend Chaser

Author: ChaoZhang, Date: 2023-11-22 16:51:27
Tags:

img

Overview

The idea of this strategy is to be a low risk strategy on trending stocks (or any other trending market), aiming to achieve minimal drawdown (e.g. at time of writing AAPL only had ~1.36% draw down, FB ~1.93% draw down and the SPY was 0.80% draw down and all remained profitable).

Principle

The strategy utilizes the 200 day Moving Average, a Custom Bollinger Band, a TSI with 52 period weighted moving average and ADX strength.

Buy signal is given when trading above the 200 moving average + 5 candles have closed above the upper custom Bollinger + the TSI is positive + ADX is above 20.

Advantages

The advantages of this strategy are low drawdown and minimum risk. It is suitable for most trending stocks with low risk operation. According to the test data, the return is high and AAPL only had the maximum drawdown of 1.36% and FB had the maximum drawdown of 1.93% during the test period.

By combining multiple technical indicators such as Bollinger Bands, MA lines, TSI indicators, and using ADX to determine the strength of the trend, it buys when the trend goes up, trying to catch the mid-to-long term upside potential of the trending stocks. Compared with judging by a single indicator, this strategy uses multiple technical indicators for more accurate and reliable judgments and lower risks.

It also contains a stop loss strategy that locks in profits by stopping losses in a timely manner when the TSI indicator changes direction, effectively controlling risks.

Risk Analysis

The main risks faced by this strategy are two:

  1. Black swan event risk. Some black swan events may cause stocks to plummet sharply and cannot be stopped loss.

  2. Trend ending risk. When the stock moves from trending to consolidation, there may be greater drawdowns.

For risk 1, more strict stop loss mechanisms can be set, or manual intervention stops can be used. For risk 2, more judgment factors can be combined to detect the end of the trend, such as increasing the trading volume indicator.

Optimization Directions

The strategy can also be optimized in the following aspects:

  1. Add a stop loss strategy to set more precise stop loss points to better control risks.

  2. Optimize the moving average parameters to test the stability of different parameter combinations.

  3. Increase momentum indicators to more accurately determine the beginning and end of trends.

  4. Test longer time cycle parameters to suit longer term operations.

Conclusion

This strategy determines buying opportunities by using ADX to determine trend strength, TSI indicators to determine trend direction, Bollinger Bands to determine breakouts, and moving averages to determine long-term trends. The verification of multiple indicators can effectively control risks. This strategy is suitable for long-term tracking of trending stocks with low drawdowns and high returns. But it still needs to be optimized for risks to make the strategy more robust.
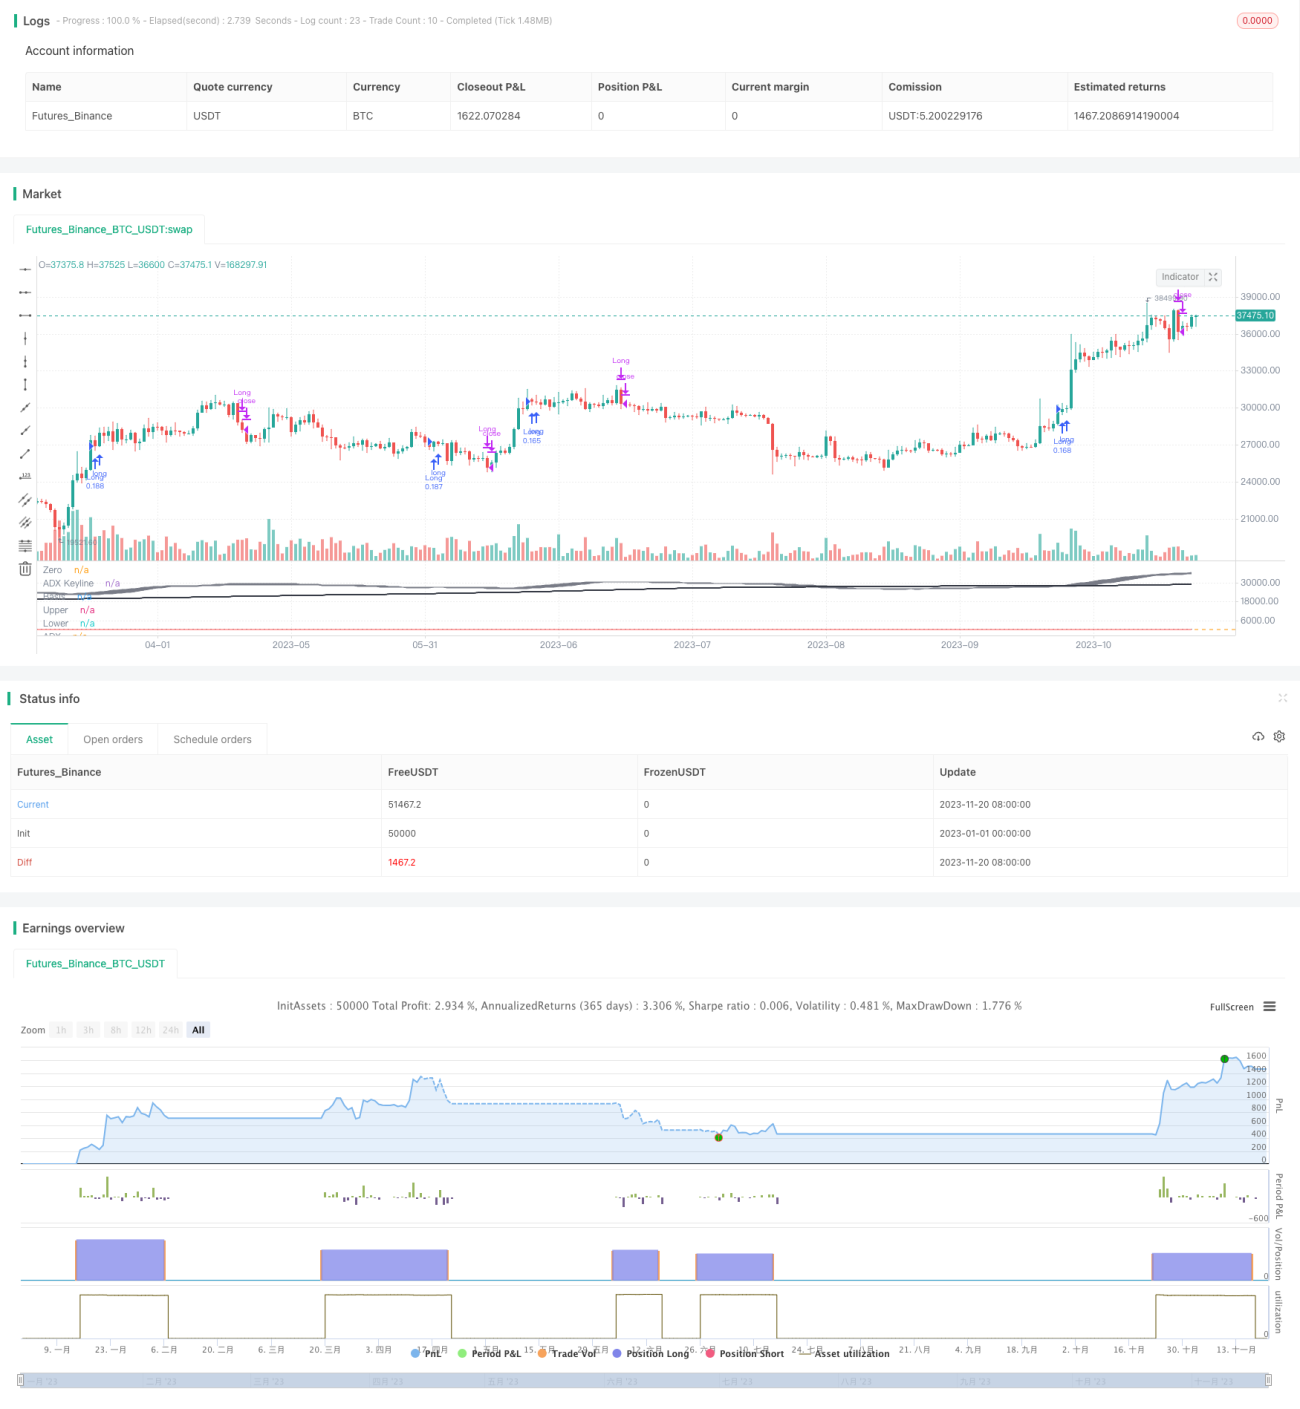

/*backtest
start: 2023-01-01 00:00:00
end: 2023-11-21 00:00:00
period: 1d
basePeriod: 1h
exchanges: [{"eid":"Futures_Binance","currency":"BTC_USDT"}]
*/

// This source code is subject to the terms of the Mozilla Public License 2.0 at https://mozilla.org/MPL/2.0/
// © gary_trades
//This script has been designed to be used on trending stocks as a low risk trade with minimal drawdown, utilising 200 Moving Average, Custom Bollinger Band, TSI with weighted moving average and ADX strength. 
//Backtest dates are set to 2010 - 2020 and all other filters (moving average, ADX, TSI , Bollinger Band) are not locked so they can be user amended if desired. 
//Buy signal is given when trading above the 200 moving average + 5 candles have closed above the upper custom Bollinger + the TSI is positive + ADX is above 20.
//As back testing proved that this traded better only in tends then some Sell/Short conditions have been removed and this focueses on  Long orders.
//Only requires 2 additional lines of code to add shorting orders.
//Close for either long or short trades is signaled once the TSI crosses in the opposite direction indicating change in trend strength or if stop loss is trggered.
//Further optimization could be achieved by adding a stop loss.
//NOTE: This only shows the lower indicators however for visualization you can use my script "CUSTOM BOLLINGER WITH SMA", which is the upper indicators in this stratergy.
//------------
//@version=4
strategy(shorttitle="Trend Chaser", title="ADX_TSI_Bol Band Trend Chaser", overlay=false, pyramiding=0,
 currency=currency.USD, default_qty_type=strategy.percent_of_equity, default_qty_value=10,
 initial_capital=10000, commission_value=0.1)
//------------
//Custom Bollinger Band
length = input(20, minval=1)
src = input(close, title="Source")
mult = input(0.382, minval=0.001, maxval=50, title="StdDev")
basis = sma(src, length)
dev = mult * stdev(src, length)
upper = basis + dev
lower = basis - dev
offset = input(0, "Offset", type = input.integer, minval = -500, maxval = 500)
plot(basis, "Basis", color=color.gray, offset = offset, display=display.none)
p1 = plot(upper, "Upper", color=color.gray, offset = offset, display=display.none)
p2 = plot(lower, "Lower", color=color.gray, offset = offset, display=display.none)
fill(p1, p2, title = "Background", color=#787B86, transp=85)
//------------
//Moving Average
MAlen = input(200, minval=1, title="Length")
MAout = sma(src, MAlen)
plot(MAout, color=color.black, title="MA", offset=offset, linewidth=2, display=display.none)
//------------
//True Strength WMA
TSlong = input(title="Long Length", type=input.integer, defval=25)
TSshort = input(title="Short Length", type=input.integer, defval=13)
TSsignal = input(title="Signal Length", type=input.integer, defval=52)
double_smooth(src, TSlong, TSshort) =>
    fist_smooth = wma(src, TSlong)
    wma(fist_smooth, TSshort)
price = close     
pc = change(price)
double_smoothed_pc = double_smooth(pc, TSlong, TSshort)
double_smoothed_abs_pc = double_smooth(abs(pc), TSlong, TSshort)
tsi_value = 100 * (double_smoothed_pc / double_smoothed_abs_pc)
tsi2 = wma(tsi_value, TSsignal)
plot(tsi_value, color=color.blue)
plot(wma(tsi_value, TSsignal), color=color.red)
hline(0, title="Zero")
//------------
//ADX
adxlen = input(13, title="ADX Smoothing")
dilen = input(13, title="DI Length")
keyLevel = input(20, title="Keylevel for ADX")
dirmov(len) =>
	up = change(high)
	down = -change(low)
	plusDM = na(up) ? na : (up > down and up > 0 ? up : 0)
    minusDM = na(down) ? na : (down > up and down > 0 ? down : 0)
	truerange = rma(tr, len)
	plus = fixnan(100 * rma(plusDM, len) / truerange)
	minus = fixnan(100 * rma(minusDM, len) / truerange)
	[plus, minus]

adx(dilen, adxlen) =>
	[plus, minus] = dirmov(dilen)
	sum = plus + minus
	adx = 100 * rma(abs(plus - minus) / (sum == 0 ? 1 : sum), adxlen)

sig = adx(dilen, adxlen)

plot(sig, color=color.black, title="ADX", style=plot.style_histogram, transp=40)
plot(20, color=color.green, title="ADX Keyline", linewidth=1)
//------------
//Identify Triggers

//Back Test Range
start = timestamp("America/New_York", 2010, 1, 1, 9,30)
end = timestamp("America/New_York", 2030, 7, 1, 0, 0)

//Custom Bollinger Band
Long1 = close > upper[5] and close[5] > upper [6]
Short1 = close < lower[5] and close[5] < lower [6]

//Moving Average
Long2 = close >= MAout[1]
Short2 = close <= MAout[1]

//True Strength WMA
Long3 = tsi_value > tsi2  
Short3 = tsi_value < tsi2

//ADX
ADXkey = adx(dilen, adxlen) > 20 and adx(dilen, adxlen) < 100

//Buy
Buy = Long1 and Long2 and Long3 and ADXkey
CloseLong = crossunder(tsi_value,tsi2)

//Short
Sell = Short1 and Short2 and Short3 and ADXkey
CloseShort = crossover(tsi_value,tsi2)
//------------
//Entry and Exit
if time >= start and time <= end
    strategy.entry("Long", true, when = Buy)

strategy.close("Long", when = CloseLong)


More