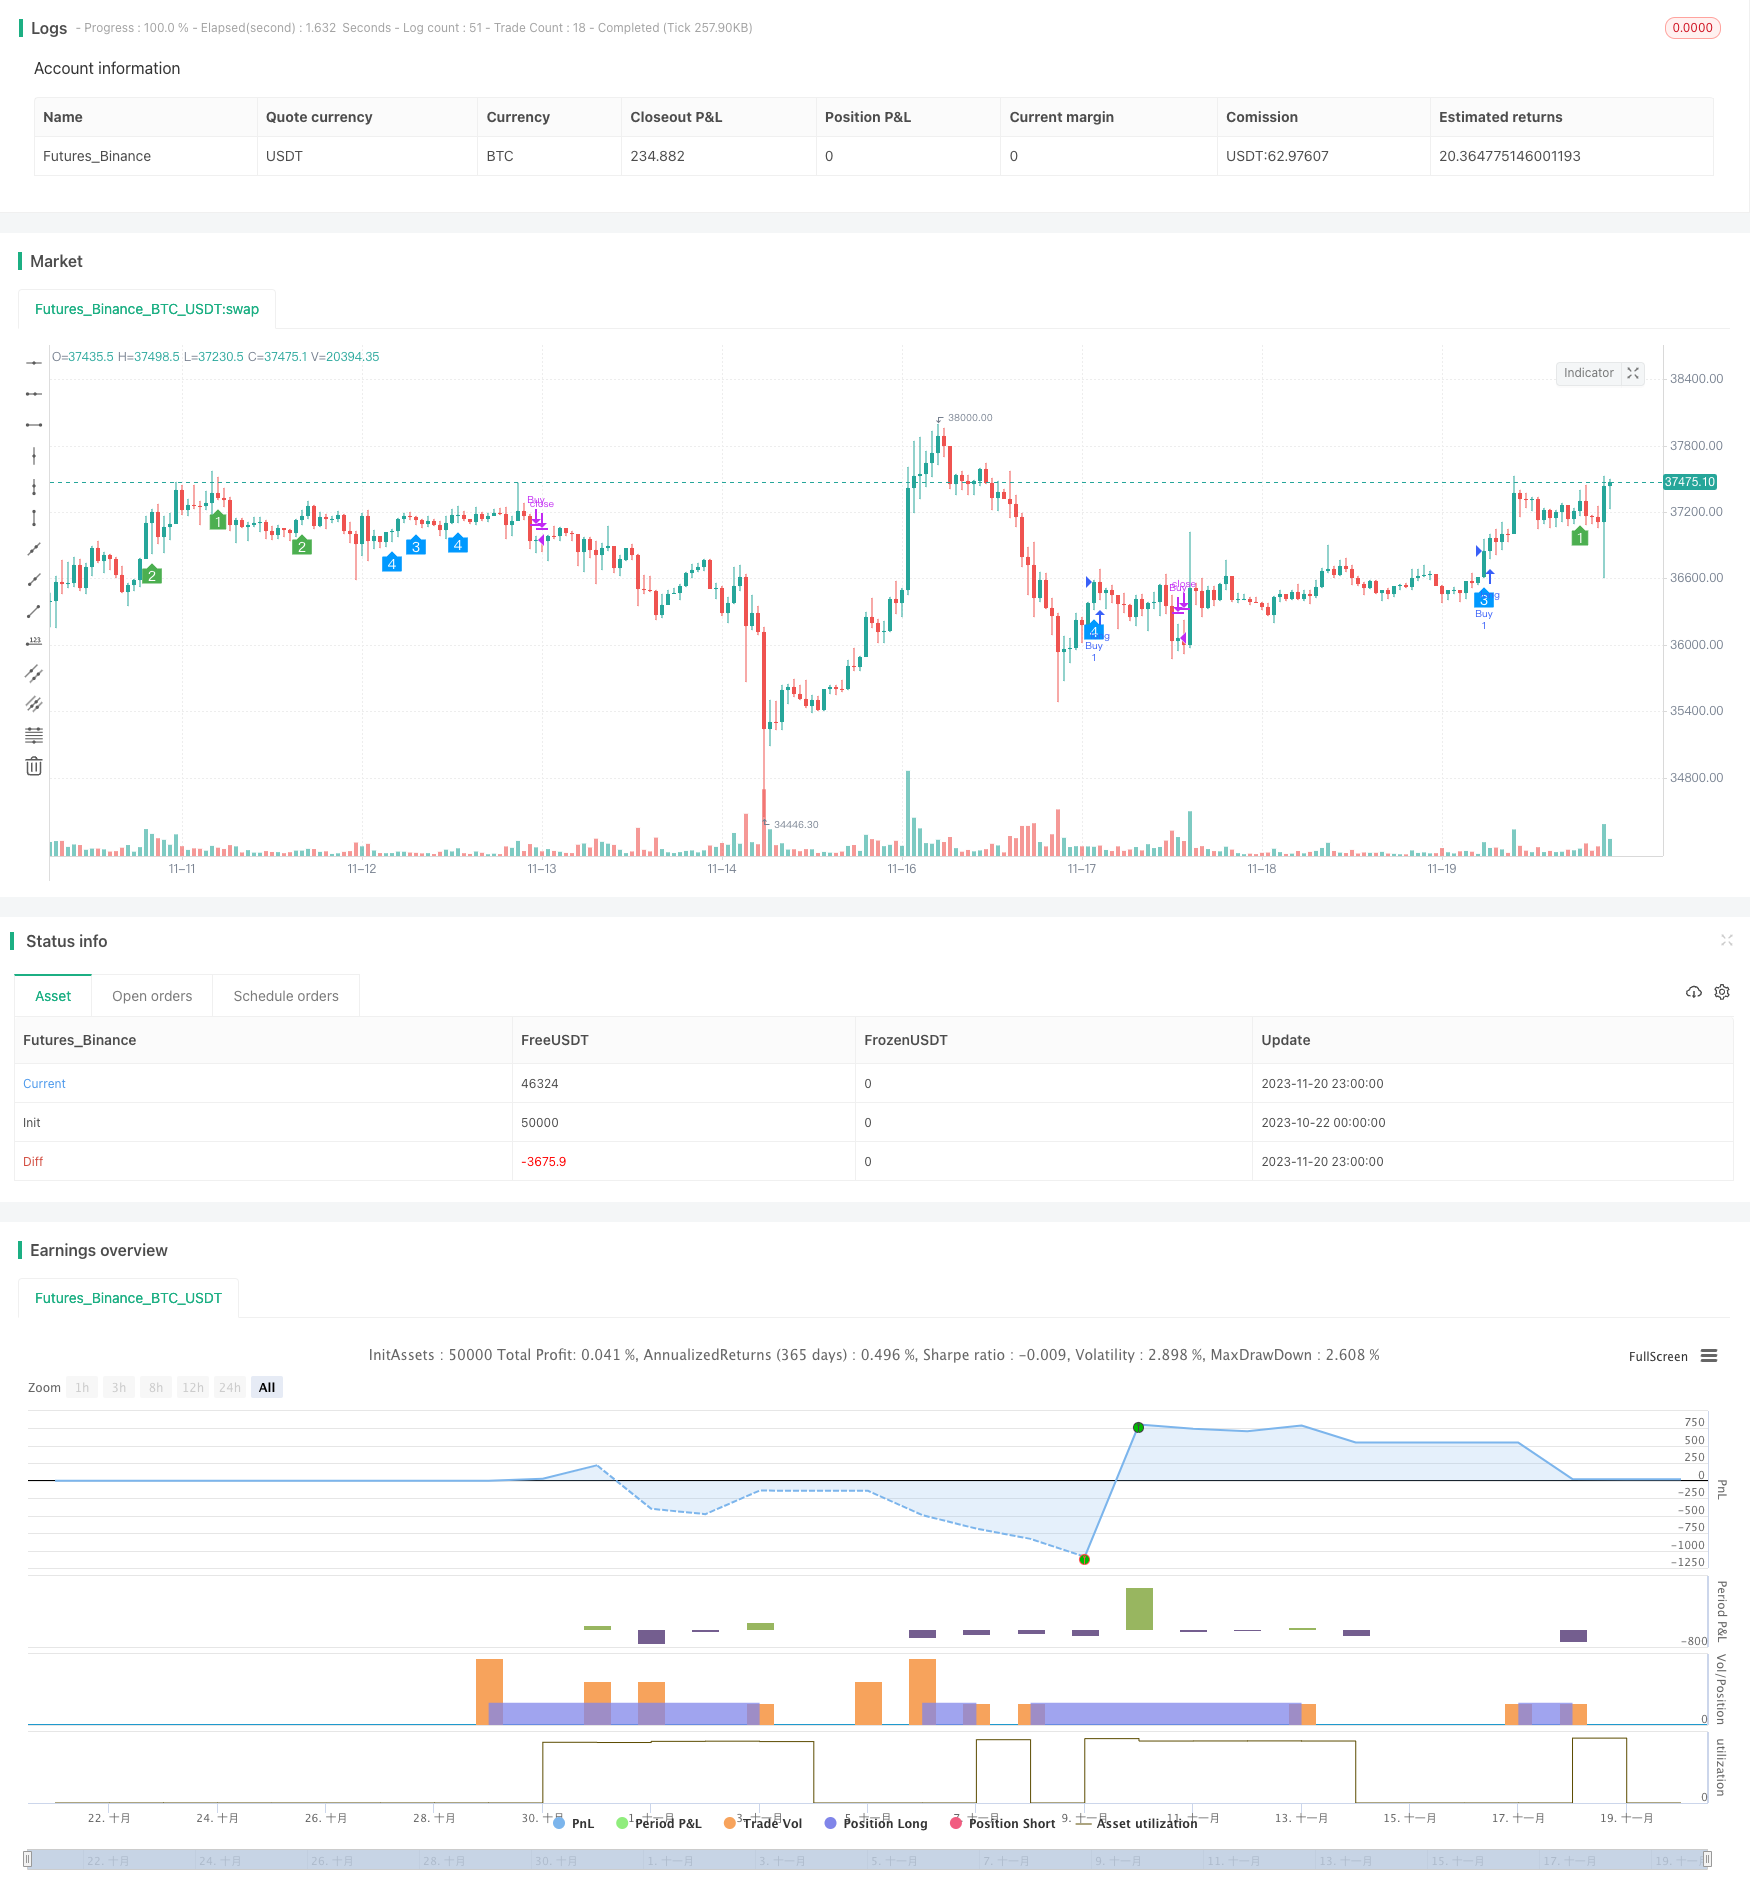
概述
速动平均线双指标交叉多空策略(Dual Moving Average Crossover Trend Strategy)是一个利用快速移动平均线和慢速移动平均线交叉形成买卖信号的趋势跟踪策略。该策略同时结合MACD,RSI等多个指标来确定趋势方向,具有较强的趋势跟踪能力。
策略原理
该策略主要基于以下几个指标进行判断:
快速移动平均线和慢速移动平均线:快速线上穿慢速线为买入信号,快速线下穿慢速线为卖出信号。
MACD:当MACD线高于Signal线且MACD最低值上升时为多头信号。
RSI:RSI高于50为多头信号,低于50为空头信号。
度量 oscillator (AO):当AO上穿0轴线为买入信号,AO下穿0轴线为卖出信号。
日线级别的三条移动平均线:日线级别较短周期移动平均线上穿较长周期移动平均线为买入信号。
该策略综合多个时间周期和多个指标,形成买入和卖出的判断逻辑。当多个指标同时出现买入信号时产生买入指令,当多个指标同时出现卖出信号时产生卖出指令,实现对趋势的跟踪。
优势分析
该策略具有以下几个优势:
多指标组合判断,避免错信号,提高判断精准度。
结合多个时间周期判断,能够识别更大级别的趋势方向。
指标参数经过优化, Parameters tuning, 具有较好的收益率。
采用移动止损来控制风险,防止亏损扩大。
自动跟踪趋势运行,无需人工干预,降低操作成本。
风险分析
该策略也存在一定的风险:
在震荡行情中可能产生较多无效交易信号。可通过优化指标参数来减少无效信号。
突发事件可能导致快速回撤。可设置移动止损来控制损失。
多空信号判定规则较复杂,参数优化需要大量历史数据支持。
跟踪止损设置不当可能导致过早止损。需要反复测试确定最优参数。
优化方向
该策略可从以下几个方向进行优化:
测试更多指标的组合,寻找更稳定和精确的交易信号。比如波动率指标,OBV指标等。
优化指标参数,减少无效交易次数。采用机器学习和遗传算法自动寻优参数。
增加模型集成技术,整合更多独立策略模型判断结果。提高稳定性。
在高频级别进入,低频级别退出。降低被套风险。
增加量化风控模块,严格控制单次止损比例,最大回撤比例等。
总结
速动平均线双指标交叉多空策略通过快速移动均线和慢速移动均线的交叉形成交易信号,并结合MACD,RSI等多个指标判断趋势方向,实现自动化的趋势跟踪。该策略优化空间较大,通过引入更多指标,调整参数以及模型集成等手段可望获得更好的策略效果。
/*backtest
start: 2023-10-22 00:00:00
end: 2023-11-21 00:00:00
period: 1h
basePeriod: 15m
exchanges: [{"eid":"Futures_Binance","currency":"BTC_USDT"}]
*/

//@version=5
strategy('SteffVans', shorttitle='SteffVans strategy', overlay=true, process_orders_on_close = true)

// Input settings
macd_fast_length = input(12)
macd_slow_length = input(26)
macd_signal_length = input(9)

// Calculate MACD values
[macd_line, signal_line, _] = ta.macd(close, macd_fast_length, macd_slow_length, macd_signal_length)
mg = ta.lowest(signal_line, 30) >= -0

// RSI
ma(source, length, type) =>
    switch type
        "SMA" => ta.sma(source, length)
        "Bollinger Bands" => ta.sma(source, length)
        "EMA" => ta.ema(source, length)
        "SMMA (RMA)" => ta.rma(source, length)
        "WMA" => ta.wma(source, length)
        "VWMA" => ta.vwma(source, length)

rsiLengthInput = input.int(14, minval=1)
rsiSourceInput = input.source(close, "Source", group="RSI Settings")
maTypeInput = input.string("SMA", title="MA Type", options=["SMA", "Bollinger Bands", "EMA", "SMMA (RMA)", "WMA", "VWMA"], group="MA Settings")
maLengthInput = input.int(14, title="MA Length", group="MA Settings")
bbMultInput = input.float(2.0, minval=0.001, maxval=50, title="BB StdDev", group="MA Settings")

up = ta.rma(math.max(ta.change(rsiSourceInput), 0), rsiLengthInput)
down = ta.rma(-math.min(ta.change(rsiSourceInput), 0), rsiLengthInput)
RSI = down == 0 ? 100 : up == 0 ? 0 : 100 - (100 / (1 + up / down))


//  AO
AO = ta.sma((high + low) / 2, 5) - ta.sma((high + low) / 2, 34)
crossaosell = AO < AO[1] and AO[1] < AO[2] and AO[2] > AO[3]  and ta.lowest(low,3)

// Uptrend sma
len1 = input.int(5, minval=1)
len2 = input.int(10, minval=1)
len3 = input.int(20, minval=1)
src = input(close)

out1 = ta.sma(src, len1)
out2 = ta.sma(src, len2)
out3 = ta.sma(src, len3)


// Timeframe
macdl60 = request.security(syminfo.tickerid, "60", signal_line,lookahead = barmerge.lookahead_on)
ao = request.security(syminfo.tickerid, "60", AO,lookahead = barmerge.lookahead_on)
rsi = request.security(syminfo.tickerid, "60", RSI,lookahead = barmerge.lookahead_on)
good = request.security(syminfo.tickerid, "60", mg,lookahead = barmerge.lookahead_on)
bad = request.security(syminfo.tickerid, "60", crossaosell,lookahead = barmerge.lookahead_on)

ma1 = request.security(syminfo.tickerid, "D", out1,lookahead = barmerge.lookahead_on)
ma2 = request.security(syminfo.tickerid, "D", out2, lookahead = barmerge.lookahead_on)
ma3 = request.security(syminfo.tickerid, "D", out3, lookahead = barmerge.lookahead_on)


// Kriteria BUY and SELL
uptrend1 =  request.security(syminfo.tickerid, "D", close,lookahead = barmerge.lookahead_on) > ma1 and ma1 > ma3 and ma2 > ma3
uptrend2 = ta.lowest(ma1,12) > ta.lowest(ma3,12) and ta.lowest(ma2,12) > ta.lowest(ma3,12)


// Triger BUY and SELL
cross1 = ao > ao[1] and ao[1] < ao[2] and ao > 0 and good and rsi >= 60 and uptrend1
cross2 = ao > 0 and ao[1] < 0 and good and rsi >=50 and uptrend1
cross3 =  ao > 0 and ao[1] < 0 and not good and uptrend2 and uptrend1
cross4 =  ao > ao[1] and ao[1] > ao[2] and ao[2] < ao[3] and ao[3] < ao[4]  and not good and uptrend2 and uptrend1

s1 = ao < ao[1] and ao[1] < ao[2] and ao[2] < ao[3] and ao > 0 and rsi < 50 and request.security(syminfo.tickerid, "D", close,lookahead = barmerge.lookahead_on) < ma1
s2 =  ao < 0 and ao < ao[2] and rsi < 50 and request.security(syminfo.tickerid, "D", close,lookahead = barmerge.lookahead_on) < ma1

// Variabel Buy dan Sell
buySignal = false
sellSignal = false

// Syarat masuk Buy
buyCondition =  cross1 or cross2 or cross3 or cross4
if buyCondition
    buySignal := true

// Syarat masuk Sell
sellCondition = s1 or s2
if sellCondition
    sellSignal := true

// Reset sinyal jika ada sinyal berulang
if buySignal and sellSignal
    sellSignal := false
if sellSignal and buySignal
    buySignal := false

// Logika perdagangan
if buySignal
    strategy.entry("Buy", strategy.long, comment = "BUY")
if sellSignal
    strategy.close("Buy")


plotshape(cross1,title = "Stefkuy1", style = shape.labelup, location = location.belowbar, color = color.green,text = "1", textcolor = color.white,size = size.small)
plotshape(cross2,title = "Stefkuy2", style = shape.labelup, location = location.belowbar, color = color.green, text = "2", textcolor= color.white, size = size.small)
plotshape(cross3,title = "StefVan1", style = shape.labelup, location = location.belowbar, color = color.rgb(0, 153, 255), text = "3", textcolor= color.white,size = size.small)
plotshape(cross4,title = "StefVan2", style = shape.labelup, location = location.belowbar, color = color.rgb(0, 153, 255), text = "4", textcolor= color.white,size = size.small)