Low-High-Trend Strategy

Overview
This strategy is designed based on the market principle of buying low and selling high. It tracks the highest and lowest prices over a certain period, establishes a long position when the price breaks through the lowest price, and closes the position when the price falls below the highest price or the take profit condition is met. At the same time, this strategy adds an optional trend filter that only allows buying when the price is in an uptrend.
Strategy Logic
Highest and Lowest Price Calculation
-
Lowest price (lowcriteria): Call ta.lowest function to calculate the lowest price over the lookback period set by user (default 20 bars) and plot the lowest price line.
-
Highest price (highcriteria): Call ta.highest function to calculate the highest price over the lookback period set by user (default 10 bars) and plot the highest price line.
Entry Signal
When the current price breaks through the lowest price line, a buy signal is triggered to establish a long position.
Exit Signal
Two exit methods are provided for option:
-
Fixed take profit: Close the position for profit when the price reaches the preset take profit level (e.g. 8% above entry price).
-
Breakdown of highest price: Close the position to cut losses when the price falls below the highest price line, judging a trend reversal.
Trend Filter
Add an EMA line to determine the trend direction. Allow buying only when the price is above EMA line (an uptrend). This filter can be enabled or disabled.
Advantage Analysis
-
Adopt the classic strategy of buying low and selling high, aligning with market fundamentals.
-
Add trend judgment to avoid frequent opening during price fluctuations.
-
Provide two exit options for pursuing high profits or reducing losses.
-
Customizable parameters adapt to more market environments.
-
Huge room for strategy optimization via parameter tuning, filter design etc.
Risk Analysis
-
Fixed take profit level fails to adjust based on actual market moves, resulting in premature profit-taking or insufficient profit target.
-
Selling at the breakdown of highest price may already generate huge losses, unable to effectively control losses.
-
EMA trend judgment only looks back a certain period, possibly lagging behind the actual trend change.
-
Backtest results cannot represent the future. Live performance has uncertainties.
Optimization Directions
-
Add profit-taking methods like trailing stop, partial exit etc. to dynamically adjust take profit level.
-
Optimize exit signals e.g. partial exits, adding other indicators.
-
Enhance trend judgment by incorporating more indicators or machine learning.
-
Optimize parameters by more extensive backtests to find optimum sets.
-
Add stop loss methods to better control losses.
Summary
This strategy generally applies the classic low buy high sell principle and can perform well under certain conditions. But there is still room for improving via parameter tuning, exit optimization, stop loss mechanisms etc. This article provides an in-depth analysis on the strategy's logic, pros, cons and optimization directions, aiming to share the strategy idea as well as remind investors of the risks and trade cautiously with quantitative strategies.
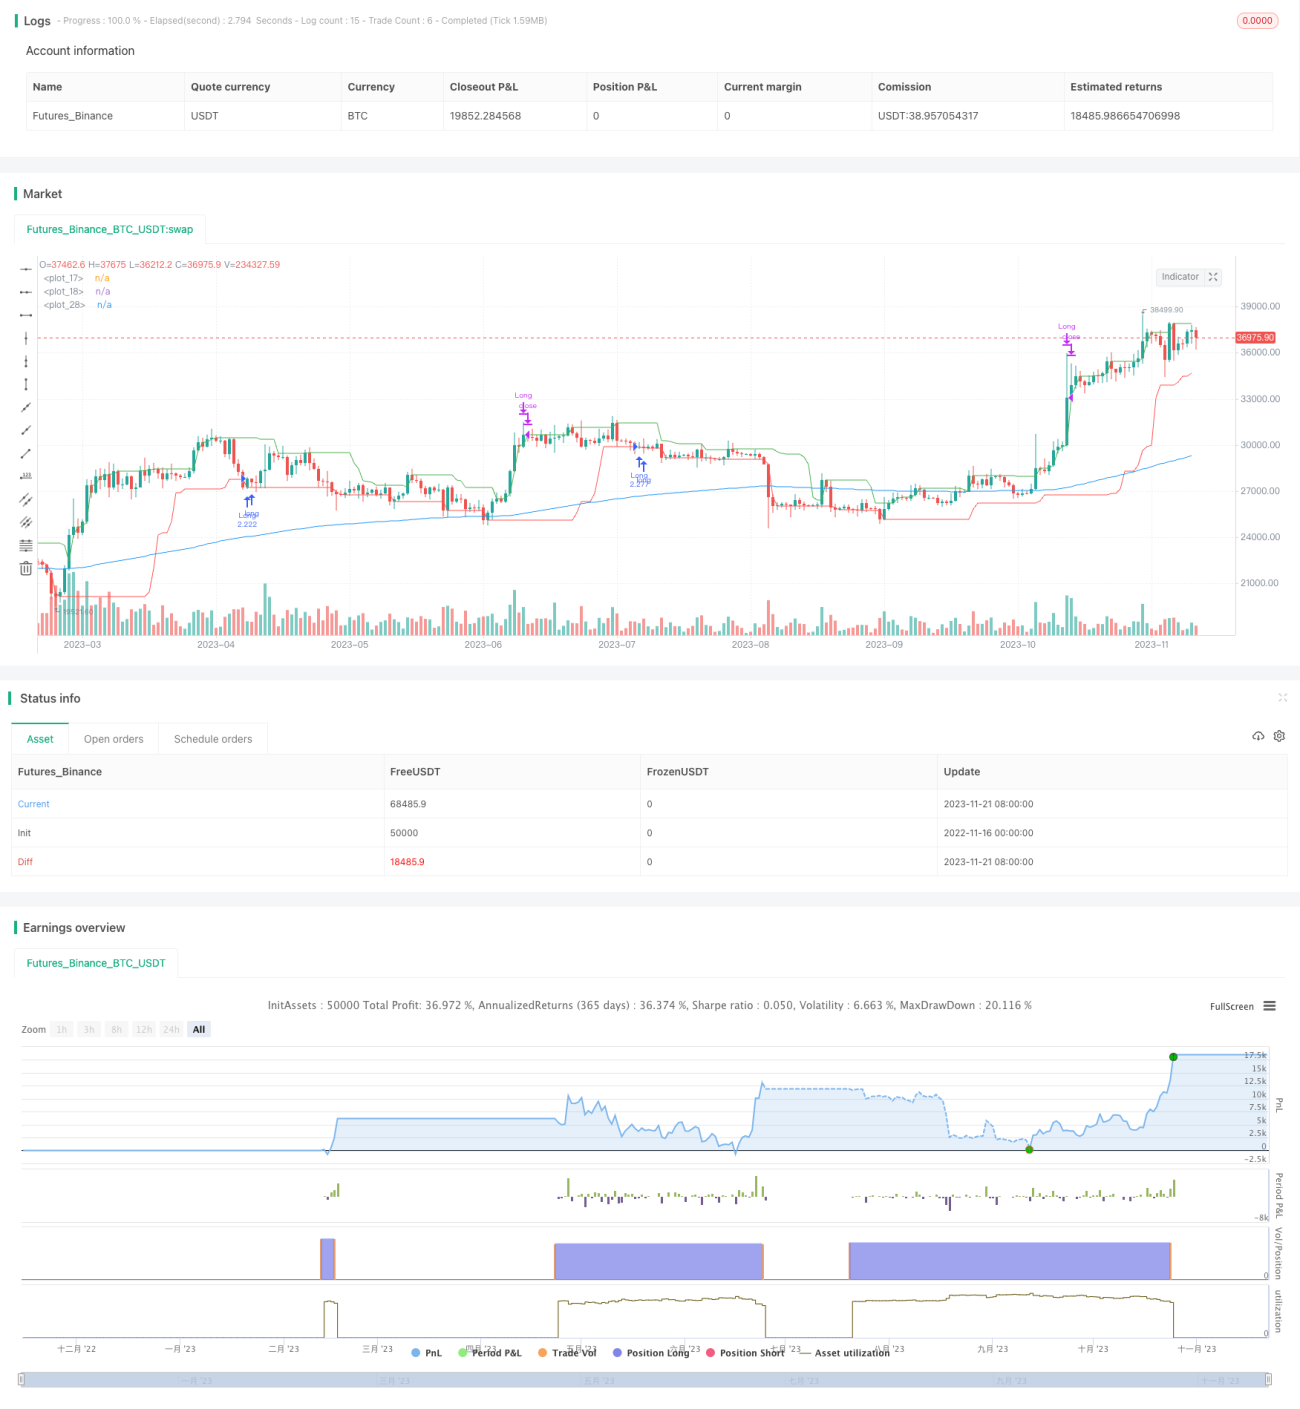
/*backtest
start: 2022-11-16 00:00:00
end: 2023-11-22 00:00:00
period: 1d
basePeriod: 1h
exchanges: [{"eid":"Futures_Binance","currency":"BTC_USDT"}]
*/

// This source code is subject to the terms of the Mozilla Public License 2.0 at https://mozilla.org/MPL/2.0/
// @version=5
// Author = TradeAutomation
- 1