Momentum Turtle Trend Tracking Strategy

Overview
The Momentum Turtle Trend Tracking strategy is a trend following strategy based on the Turtle Trading rules. It uses the Turtle Indicators to identify trends and combines momentum metrics to filter out some noise trades. The main advantage of this strategy is the ability to capture strong price trends and achieve excess returns.
Strategy Principle
This strategy uses the breakout system in the Turtle Indicators to determine the trend direction. Specifically, when the closing price is higher than the highest price over the past 20 days, it is a bullish signal and goes long; when the closing price is lower than the lowest price over the past 20 days, it is a bearish signal and the strategy goes short.
To filter out some noise trades, this strategy also incorporates a momentum factor. If the price fluctuation is less than 5 ATRs, the strategy will not enter trades. This avoids losses from whipsaws in sideways markets.
After opening positions, the strategy uses the N-breakout exits in the original Turtle rules for stop loss. This system sets the stop loss based on the highest and lowest prices over the past 20 days. For example, the stop loss for long positions would be 2N ATRs below the lowest low over the past 20 days. The profit taking for this strategy is simple - set at 10% of total account value.
Advantage Analysis
The biggest advantage of this strategy is that it combines both trend following and momentum management. The Turtle system can accurately capture mid-term trends in prices without being disturbed by market noise. The additional ATR momentum filter further reduces unnecessary number of trades, thus greatly increasing profit potential.
Specifically, this strategy has the following strengths:
- Turtle indicators accurately identify trends and track mid-term trends.
- Momentum filters reduce unnecessary trades and avoid losing on trade frequency.
- Solid risk control measures allow timely stop losses when trends reverse.
- Overall the strategy tuning aligns well with original Turtle principles.
Risk Analysis
Although there is large potential for further optimization, the strategy also carries some risks to guard against:
- Fails to address excessive fluctuations for long-term holdings. Turtle position sizing does not consider volatility which may lead to oversized losses.
- Stop loss prices risk being taken out during extreme reversals, leading to higher than expected losses.
- Lack of profit targets means excessive holdings and risk of holding underwater positions.
Enhancement Opportunities
Based on the above risks, the main optimization opportunities include:
- Consider dynamic position sizing models adjusted for volatility to trim size on losing trades.
- Add reversal mechanisms to reduce or reverse on topping patterns like head & shoulders or double tops.
- Add profit targets so that holdings are reduced when cumulative profits reach a % of total capital.
Conclusion
Overall the Momentum Turtle Trend Tracking strategy is a robust system for mid to long term trend following. It combines Turtle indicators for trend identification and ATR filters for volatility management to capture strong trends. Additionally risk controls and parameter tuning are solid to reduce drawdowns. Further enhancements like dynamic sizing, reversals and profit taking can improve performance.
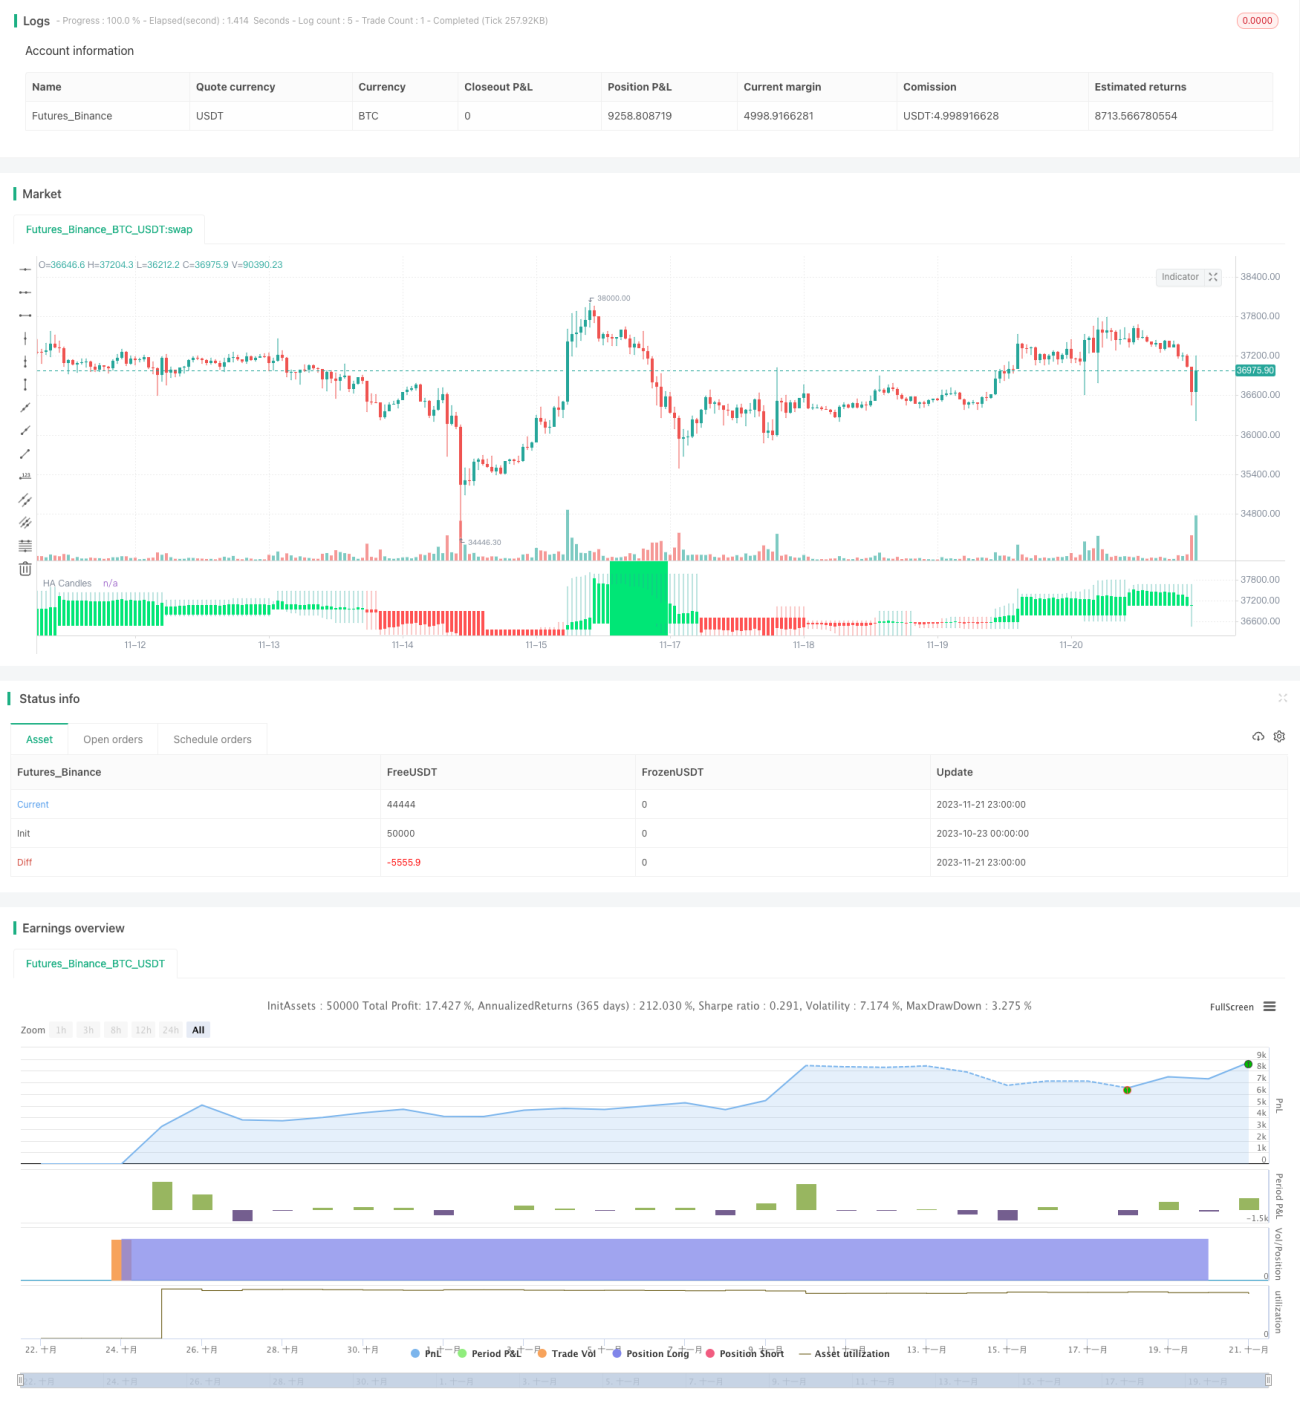
/*backtest
start: 2023-10-23 00:00:00
end: 2023-11-22 00:00:00
period: 1h
basePeriod: 15m
exchanges: [{"eid":"Futures_Binance","currency":"BTC_USDT"}]
*/

//@version=4
strategy("Heiken Ashi BF 🚀", overlay=false, initial_capital=10000, default_qty_type=strategy.percent_of_equity, default_qty_value=100, commission_type=strategy.commission.percent, commission_value=0.075)

/////////////// Time Frame ///////////////- 1