Momentum Combined with Trend Judgment Multi-factor Quantitative Trading Strategy

Overview
This strategy is a multi-factor judged quantitative trading strategy that combines momentum indicators and trend indicators. The strategy judges the overall trend and momentum direction of the market by calculating mathematical combinations of multiple moving averages, and generates trading signals based on threshold conditions.
Strategy Principle
- Calculate multiple moving averages and momentum indicators
- Calculate Harmonics moving average, short-term moving average, medium-term moving average, long-term moving average and other multiple moving averages
- Calculate the difference between each moving average to reflect the trend of price changes
- Calculate the first order derivative of each moving average to reflect the momentum of price changes
- Calculate the sine and cosine indicators to determine the trend direction
- Comprehensively judge trading signals
- Weighted calculation of momentum indicators, trend indicators and other multi-factors
- Judge the current market state according to the distance between the result value and the threshold
- Issue long and short trading signals
Advantage Analysis
- Multi-factor judgment improves signal accuracy
- Comprehensively consider price, trend, momentum and other factors
- Different factors can be configured with different weights
- Adjustable parameters, adaptable to different markets
- Parameters of moving averages, boundary of trading range can be customized
- Can adapt to different cycles and market environments
- Clear code structure, easy to understand
- Naming specifications, complete comments
- Easy to secondary development and optimization
Risk Analysis
- Difficulty in parameter optimization is high
- Requires a lot of historical data backtesting to find the optimal parameters
- Trading frequency may be too high
- Multi-factor combination judgment may result in too many transactions
- High correlation with market
- Trend judgment strategies are prone to irrational behavior
Optimization Directions
- Add stop loss logic
- Avoid major losses caused by irrational behaviors
- Optimize parameter settings
- Find optimal parameter combinations to improve strategy stability
- Increase machine learning elements
- Use deep learning to judge current market state and assist strategy decisions
Summary
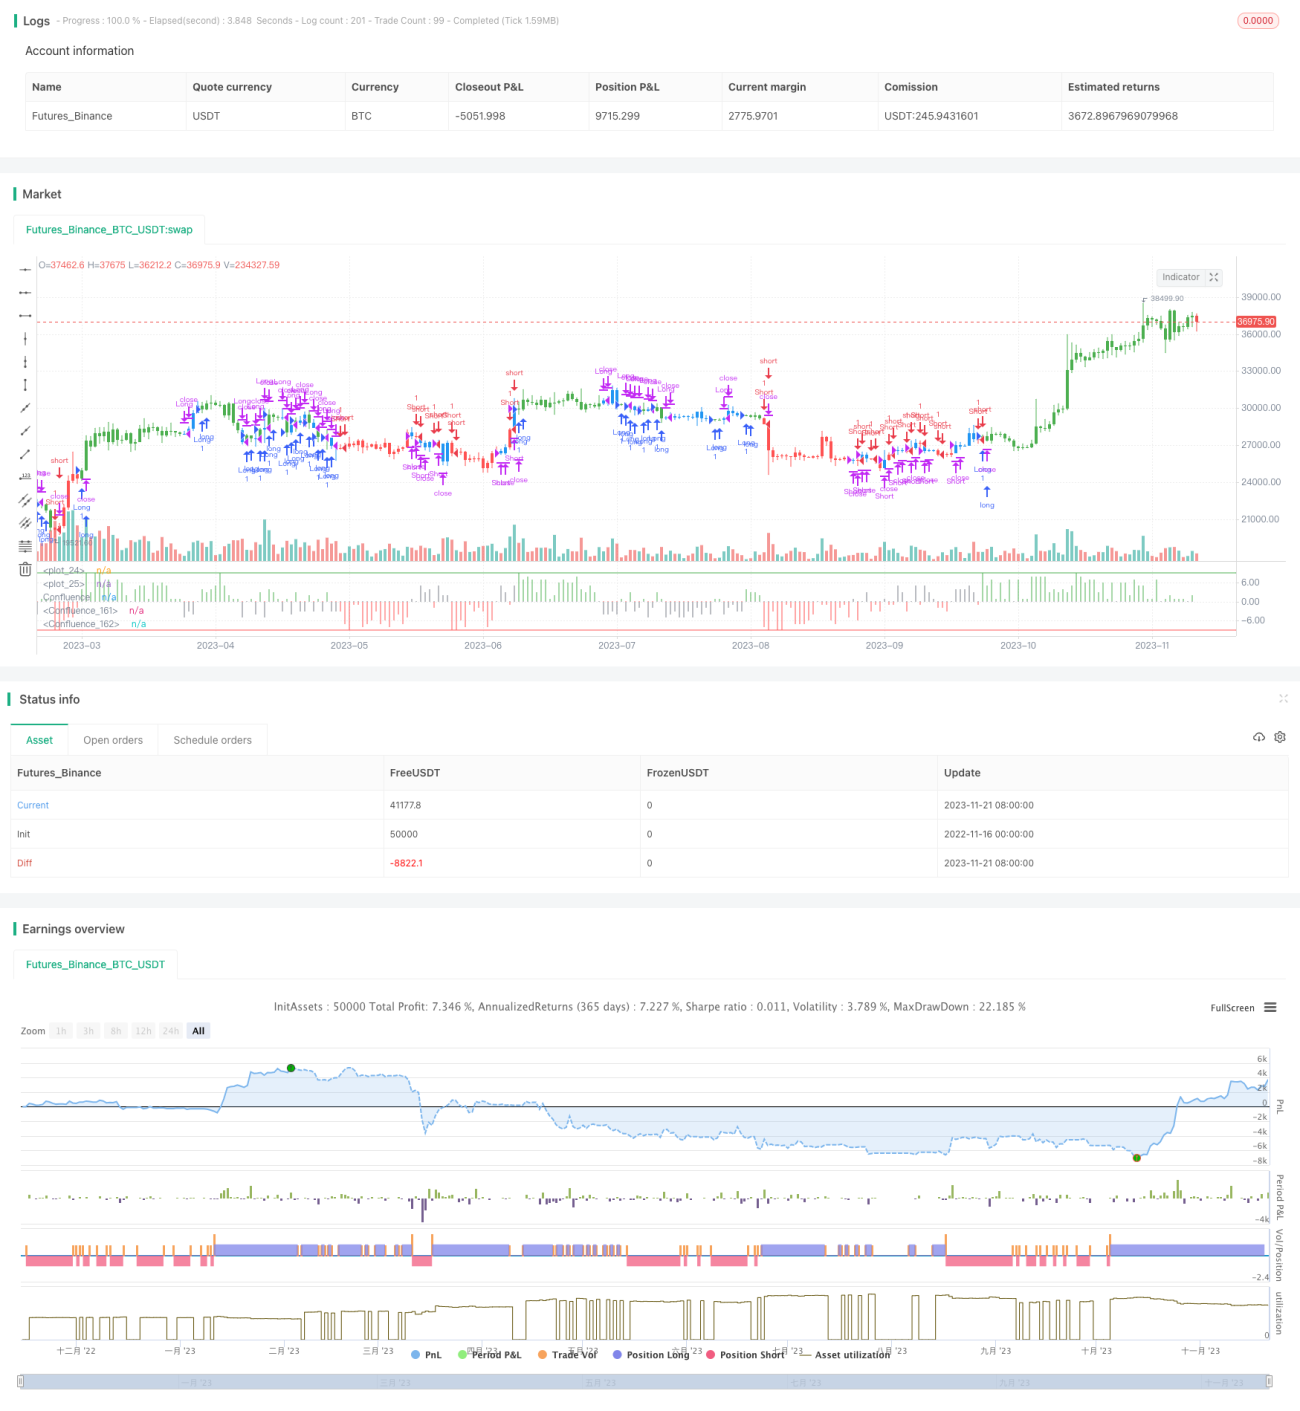
This strategy judges the market state through the multi-factor combination of momentum indicators and trend indicators, and issues trading signals based on set thresholds. The advantages of the strategy are strong configurability, adaptability to different market environments, and easy understanding; the disadvantages are the difficulty in parameter optimization, possibly too high trading frequency, and high correlation with the market. Future optimizations can be made by adding stop loss, parameter optimization and machine learning.
/*backtest
start: 2022-11-16 00:00:00
end: 2023-11-22 00:00:00
period: 1d
basePeriod: 1h
exchanges: [{"eid":"Futures_Binance","currency":"BTC_USDT"}]
*/

//@version=2
////////////////////////////////////////////////////////////
//  Copyright by HPotter v1.0 14/03/2017
// This is modified version of Dale Legan's "Confluence" indicator written by Gary Fritz.- 1