Personalized Momentum Trading Strategy

Author: ChaoZhang, Date: 2023-11-23 15:18:27
Tags:

img

Overview

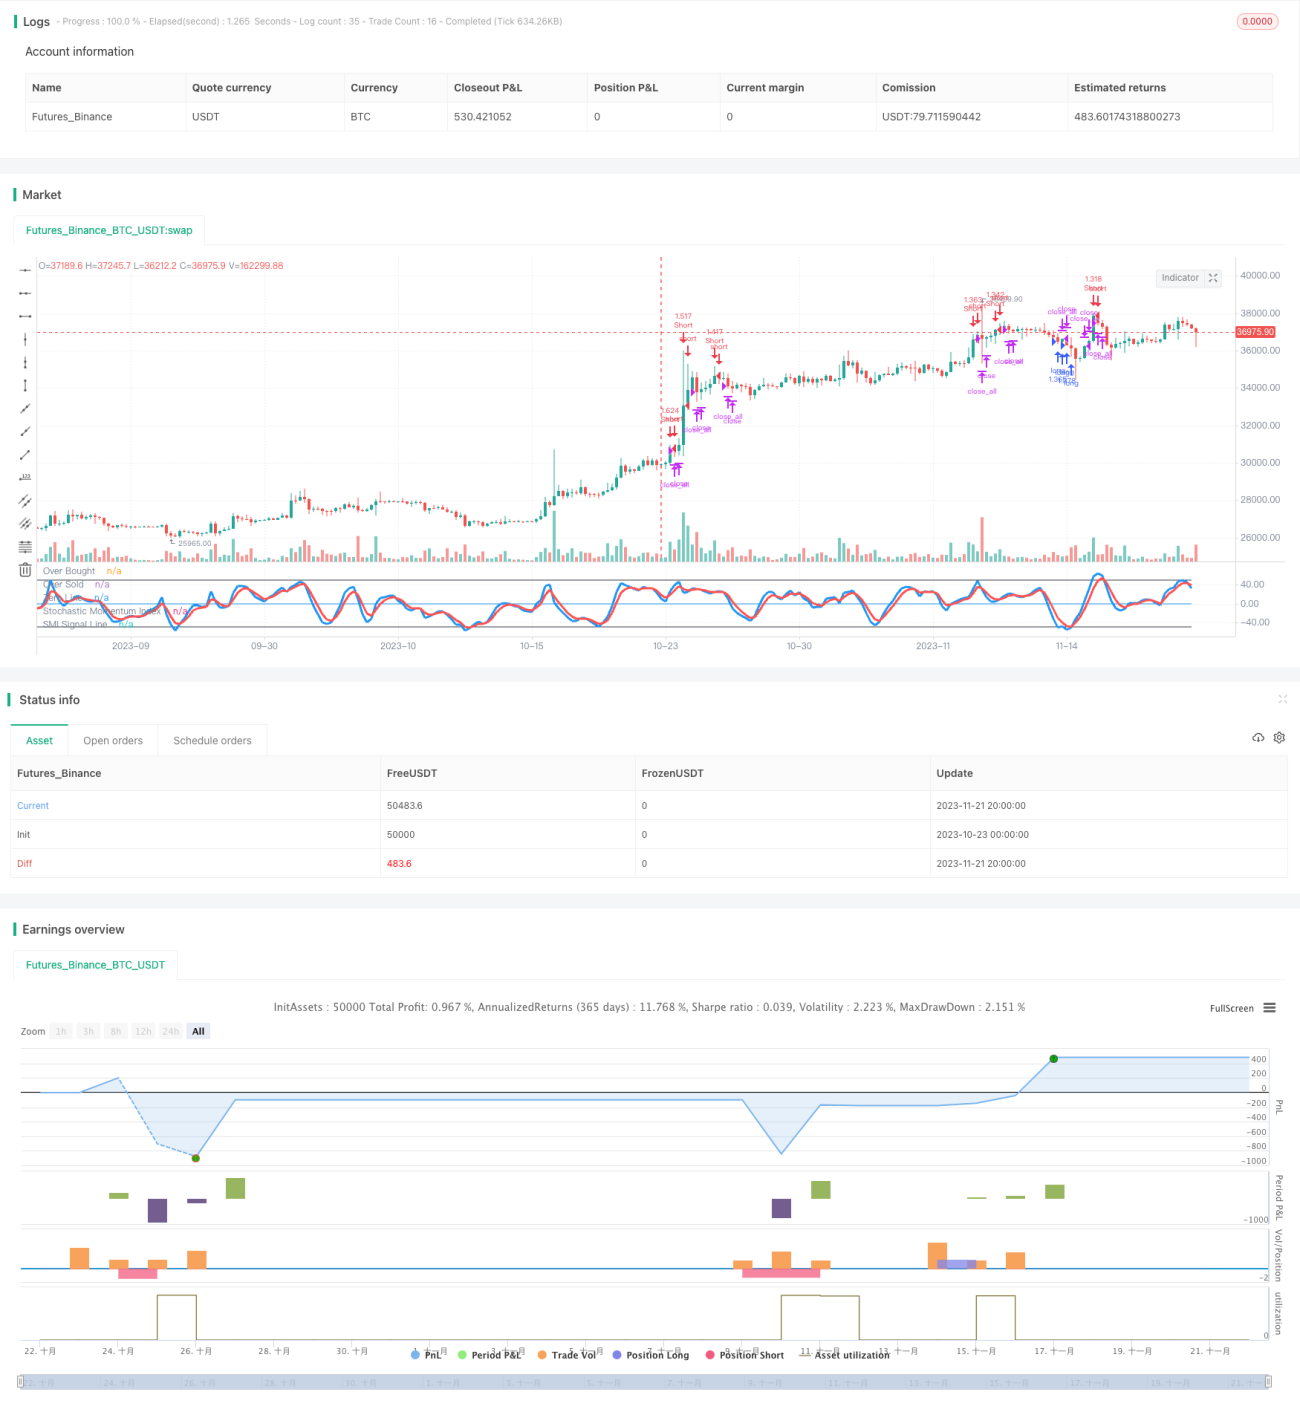
This is a personalized trading strategy that combines momentum indicators and candlestick entity filtering. It comprehensively uses three technical indicators - Stochastic Momentum Index, fast RSI and candlestick entity filtering to implement a momentum breakthrough-based strategy while also considering overbought and oversold conditions.

Trading Logic

The strategy uses the following three indicators for trading signal judgment:

  1. Stochastic Momentum Index (SMI): It combines the spacing between candlestick entities and the relative position of the closing price to judge the strength or weakness of price momentum. It generates a buy signal when SMI crosses above the boundary line and a sell signal when crossing below the boundary line.

  2. Fast RSI (7-day line): It judges the overbought and oversold conditions of prices. RSI below 20 generates a buy signal as oversold while above 80 generates a sell signal as overbought.

  3. Candlestick Entity Filter: Calculate the average candlestick entity size over the past 10 days. Only enable the signal when today’s candlestick entity exceeds one-third of that average to avoid invalid signals.

The strategy first judges the signals from SMI and RSI. If either indicator signal requirement is met, then combine the candlestick entity filter to determine if that signal is valid and generate a trading signal if valid.

Advantage Analysis

The strategy has the following advantages:

  1. Judgment is more precise and reliable with combination of multiple indicators.

  2. Addition of candlestick entity filter avoids invalid signals.

  3. By combining overbought/oversold conditions, it is easier to capture signals at trend reversal points.

  4. Increased profit opportunities with dual-directional long/short trading.

  5. Partial position trading avoids excessive single-time loss.

Risk Analysis

The strategy also has some risks:

  1. Indicators can generate false signals leading to losses. Parameter optimization can reduce false signals.

  2. Partial position trading cannot fully utilize the trend opportunities in each direction. Higher returns can be achieved by amplifying trading position size.

  3. As the main indicator, SMI is sensitive to parameter settings. Improper configuration may miss trading opportunities or increase false signals.

  4. Frequent trading with dual-directional strategy increases transaction costs.

Optimization Directions

The strategy can be further optimized in the following aspects:

  1. Optimize parameters for SMI and RSI to find best parameter combinations.

  2. Increase position sizing and position management mechanisms to achieve higher returns during trends.

  3. Add stop loss strategies to reduce single-time loss risk.

  4. Combine more indicators to judge signal reliability and reduce false signals.

  5. Adopt efficient contracts to reduce transaction costs.

Conclusion

The strategy comprehensively utilizes the SMI, fast RSI and candlestick entity filtering indicators to implement a momentum-based, overbought/oversold-aware personalized trading strategy. It has advantages like precise judgment, identification of valid signals, combination of overbought/oversold conditions and dual-directional trading, but also risks like parameter sensitivity, inability to fully capitalize trends, and frequent operations. By continuously optimizing parameters, increasing position sizing and stop loss management, reducing false signals etc., the strategy can achieve better trading performance.


/*backtest
start: 2023-10-23 00:00:00
end: 2023-11-22 00:00:00
period: 6h
basePeriod: 15m
exchanges: [{"eid":"Futures_Binance","currency":"BTC_USDT"}]
*/

//Noro
//2018

//@version=2
strategy(title = "Noro's Stochastic Strategy v1.2", shorttitle = "Stochastic str 1.2", overlay = false, default_qty_type = strategy.percent_of_equity, default_qty_value = 100, pyramiding = 0)

//Settings 
needlong = input(true, defval = true, title = "Long")
needshort = input(true, defval = true, title = "Short")
usemar = input(false, defval = false, title = "Use Martingale")
capital = input(100, defval = 100, minval = 1, maxval = 10000, title = "Capital, %")
usesmi = input(true, defval = true, title = "Use SMI Strategy")
usersi = input(true, defval = true, title = "Use RSI Strategy")
usebod = input(true, defval = true, title = "Use Body-Filter")
a = input(5, "SMI Percent K Length")
b = input(3, "SMI Percent D Length")
limit = input(50, defval = 50, minval = 1, maxval = 100, title = "SMI Limit")
fromyear = input(2017, defval = 2017, minval = 1900, maxval = 2100, title = "From Year")
toyear = input(2100, defval = 2100, minval = 1900, maxval = 2100, title = "To Year")
frommonth = input(01, defval = 01, minval = 01, maxval = 12, title = "From Month")
tomonth = input(12, defval = 12, minval = 01, maxval = 12, title = "To Month")
fromday = input(01, defval = 01, minval = 01, maxval = 31, title = "From day")
today = input(31, defval = 31, minval = 01, maxval = 31, title = "To day")

//Fast RSI
fastup = rma(max(change(close), 0), 7)
fastdown = rma(-min(change(close), 0), 7)
fastrsi = fastdown == 0 ? 100 : fastup == 0 ? 0 : 100 - (100 / (1 + fastup / fastdown))

//Stochastic Momentum Index
ll = lowest (low, a)
hh = highest (high, a)
diff = hh - ll
rdiff = close - (hh+ll)/2
avgrel = ema(ema(rdiff,b),b)
avgdiff = ema(ema(diff,b),b)
SMI = avgdiff != 0 ? (avgrel/(avgdiff/2)*100) : 0
SMIsignal = ema(SMI,b)

//Lines
plot(SMI, color = blue, linewidth = 3, title = "Stochastic Momentum Index")
plot(SMIsignal, color = red, linewidth = 3, title = "SMI Signal Line")
plot(limit, color = black, title = "Over Bought")
plot(-1 * limit, color = black, title = "Over Sold")
plot(0, color = blue, title = "Zero Line")

//Body Filter
nbody = abs(close - open)
abody = sma(nbody, 10)
body = nbody > abody / 3 or usebod == false

//Signals
up1 = SMI < -1 * limit and close < open and body and usesmi
dn1 = SMI > limit and close > open and body and usesmi
up2 = fastrsi < 20 and close < open and body and usersi
dn2 = fastrsi > 80 and close > open and body and usersi
exit = ((strategy.position_size > 0 and close > open) or (strategy.position_size < 0 and close < open)) and body

//Trading
profit = exit ? ((strategy.position_size > 0 and close > strategy.position_avg_price) or (strategy.position_size < 0 and close < strategy.position_avg_price)) ? 1 : -1 : profit[1]
mult = usemar ? exit ? profit == -1 ? mult[1] * 2 : 1 : mult[1] : 1
lot = strategy.position_size == 0 ? strategy.equity / close * capital / 100 * mult : lot[1]

if up1 or up2
    if strategy.position_size < 0
        strategy.close_all()
        
    strategy.entry("long", strategy.long, needlong == false ? 0 : lot, when=(time > timestamp(fromyear, frommonth, fromday, 00, 00) and time < timestamp(toyear, tomonth, today, 23, 59)))

if dn1 or dn2
    if strategy.position_size > 0
        strategy.close_all()
        
    strategy.entry("Short", strategy.short, needshort == false ? 0 : lot, when=(time > timestamp(fromyear, frommonth, fromday, 00, 00) and time < timestamp(toyear, tomonth, today, 23, 59)))
    
if time > timestamp(toyear, tomonth, today, 23, 59) or exit
    strategy.close_all()

More