The Bollinger Bands Stop Loss Strategy

Overview
The Bollinger Bands Strategy is a classic strategy that utilizes Bollinger Bands for trend tracking and overbought/oversold signals. This version adds stop loss mechanisms to control risks over the original strategy.
The strategy judges overbought/oversold conditions through golden/dead crossovers of the upper/lower Bollinger Bands to establish positions. The area between the bands reflects current market volatility range. The bands consist of middle, upper and lower bands, where the middle band is the N-day simple moving average and the upper/lower bands are middle band +/- K standard deviations.
Principles
Bollinger Bands reflect market volatility and oscillation range. Touching the lower band means oversold status quo - gaps have higher probabilities of being filled up. Thus long positions should be considered based on mean-reversion principle. Likewise, touching the upper band represents potential overbought conditions and likely price reversals, so short positions can be established to profit on the down moves.
This strategy combines the overbought/oversold signals from Bollinger Bands for trend tracking entries. Stop loss mechanisms are incorporated to control risks.
When price crosses above the lower band, market exits oversold area into reasonable range. Long positions can be opened. When price crosses below upper band, market becomes overbought. Shorts can then be opened.
After orders are filled, fixed percentage stop loss levels are set to manage risks. When losses exceed stop loss percentage, current positions are stopped out to limit further losses.
Advantages
-
Identify overbought/oversold levels with Bollinger Bands for low-buy-high-sell setups judging by band crossovers.
-
Capture trends through volatility property of Bollinger Bands.
-
Stop loss mechanism effectively limits max loss per trade.
-
Combining trend tracking and stop loss leads to steady gains.
Risks and Optimization
-
Parameter settings impacts signal quality. Middle band length N and standard deviation multiplier K should be rationally set for different markets, or accuracy will suffer.
-
Oversized or undersized stop loss hurts return stability. Overlarge percentage risks heavier losses per trade, while undersized percentage risks premature stop loss triggers. Reasonable percentage should be set based on different products.
-
Additional filters with other indicators may improve signal accuracy.
-
Different holding period settings can be tested, such as combining hourly or shorter period bands for higher frequency trading and capital usage efficiency improvements.
Conclusion
This strategy leverages Bollinger Bands for overbought/oversold signals and incorporates stop loss for risk control. It is a common trend tracking strategy. Through optimizing parameters, integrating more accurate signals and stop loss levels, steady profits can be achieved.
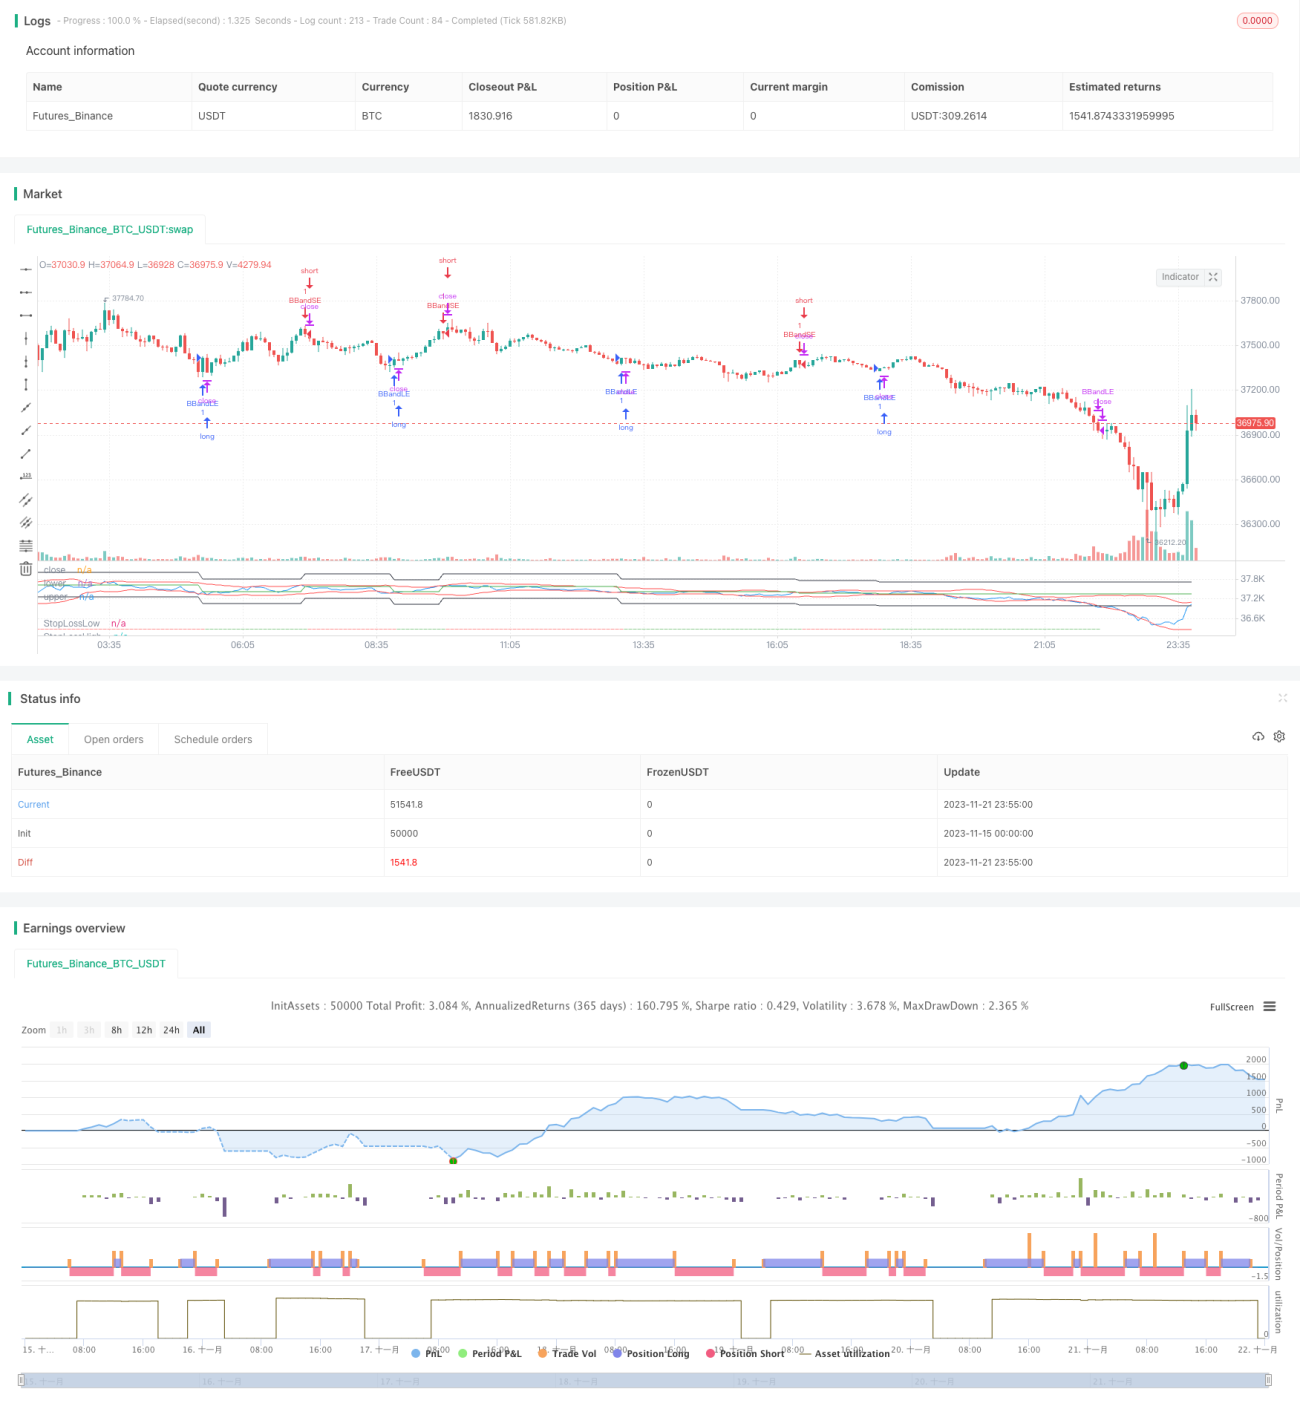
/*backtest
start: 2023-11-15 00:00:00
end: 2023-11-22 00:00:00
period: 5m
basePeriod: 1m
exchanges: [{"eid":"Futures_Binance","currency":"BTC_USDT"}]
*/

//@version=5
strategy(title="Bollinger Bands Strategy", overlay=false, shorttitle="BBS", pyramiding=0, currency=currency.USD, commission_type=strategy.commission.percent, commission_value=0.03, initial_capital=1000)
source = input(close, "Source")
length = input.int(20, minval=1)- 1