RSI Axial Moving Average Crossover Strategy

Overview
The RSI Axial Moving Average Crossover Strategy generates trading signals by calculating the RSI indicator and its simple moving average line and observing golden crosses and dead crosses between the two. The strategy also incorporates Bollinger Bands to add support/resistance judgment for the RSI axial moving average line.
Strategy Logic
The strategy first calculates the 14-day RSI indicator, followed by the 8-day simple moving average line of the RSI indicator. A buy signal is generated when the RSI indicator crosses above its moving average line, while a sell signal is generated when the RSI crosses below its moving average line.
At the same time, the strategy adds Bollinger Bands to determine if the RSI axial moving average line is relatively overcrowded by calculating the standard deviation, thus avoiding buying peaks and selling bottoms.
Advantage Analysis
The RSI Axial Moving Average Crossover Strategy combines the trending indicator RSI and the curve-following indicator moving average line, which can effectively determine market trends and randomness. The arithmetic average of the RSI indicator can smooth out the impact of price fluctuations on signals.
The Bollinger Bands added in this strategy use the principle of standard deviation to automatically adjust the width of the upper and lower tracks, effectively preventing erroneous trading signals. When the Bollinger Bands narrow, it indicates that the change is gradually slowing down, which is suitable for looking for reversal opportunities. When the Bollinger Bands expand, it indicates a period of violent market fluctuation, which is suitable for tracking trends.
Risk Analysis
The biggest risk of the RSI Axial Moving Average Crossover Strategy is the lagging of the RSI indicator and moving average lines themselves. When rapid market movements occur, the indicator calculation and trend judgment will lag to some extent. This will lead to raised buy points and lowered sell points.
Another major risk is the misguidance of indicators when market trend turns from bull to bear or vice versa, while RSI and MA indicators fail to react in time, resulting in losing trades.
Solutions include appropriately adjusting RSI parameters, shortening MA periods, adding trend indicators to assist in judgment, and appropriately widening stop loss range.
Optimization Directions
The RSI Axial Moving Average Crossover Strategy can be optimized in the following aspects:
-
Optimize RSI parameters: Adjust RSI length to balance sensitivity and stability
-
Optimize MA parameters: Adjust MA type and period parameters to optimize trend-following
-
Add stop loss mechanisms: Set moving or time stop loss to control single loss
-
Incorporate trend indicators: Add MACD, KDJ etc. to avoid reversal misjudgements
-
Multi-timeframe verification: Use higher timeframes to determine trends to avoid being trapped
Conclusion
The RSI Axial Moving Average Crossover Strategy is an overall mature quantitative trading strategy. It combines the advantages of multiple technical indicators and can catch mainstream market moves through parameter tuning and multi-dimensional optimization. The biggest risk is the lagging of indicators, which needs to be addressed by stop losses to control losses. When properly implemented, this strategy can yield relatively stable investment returns.
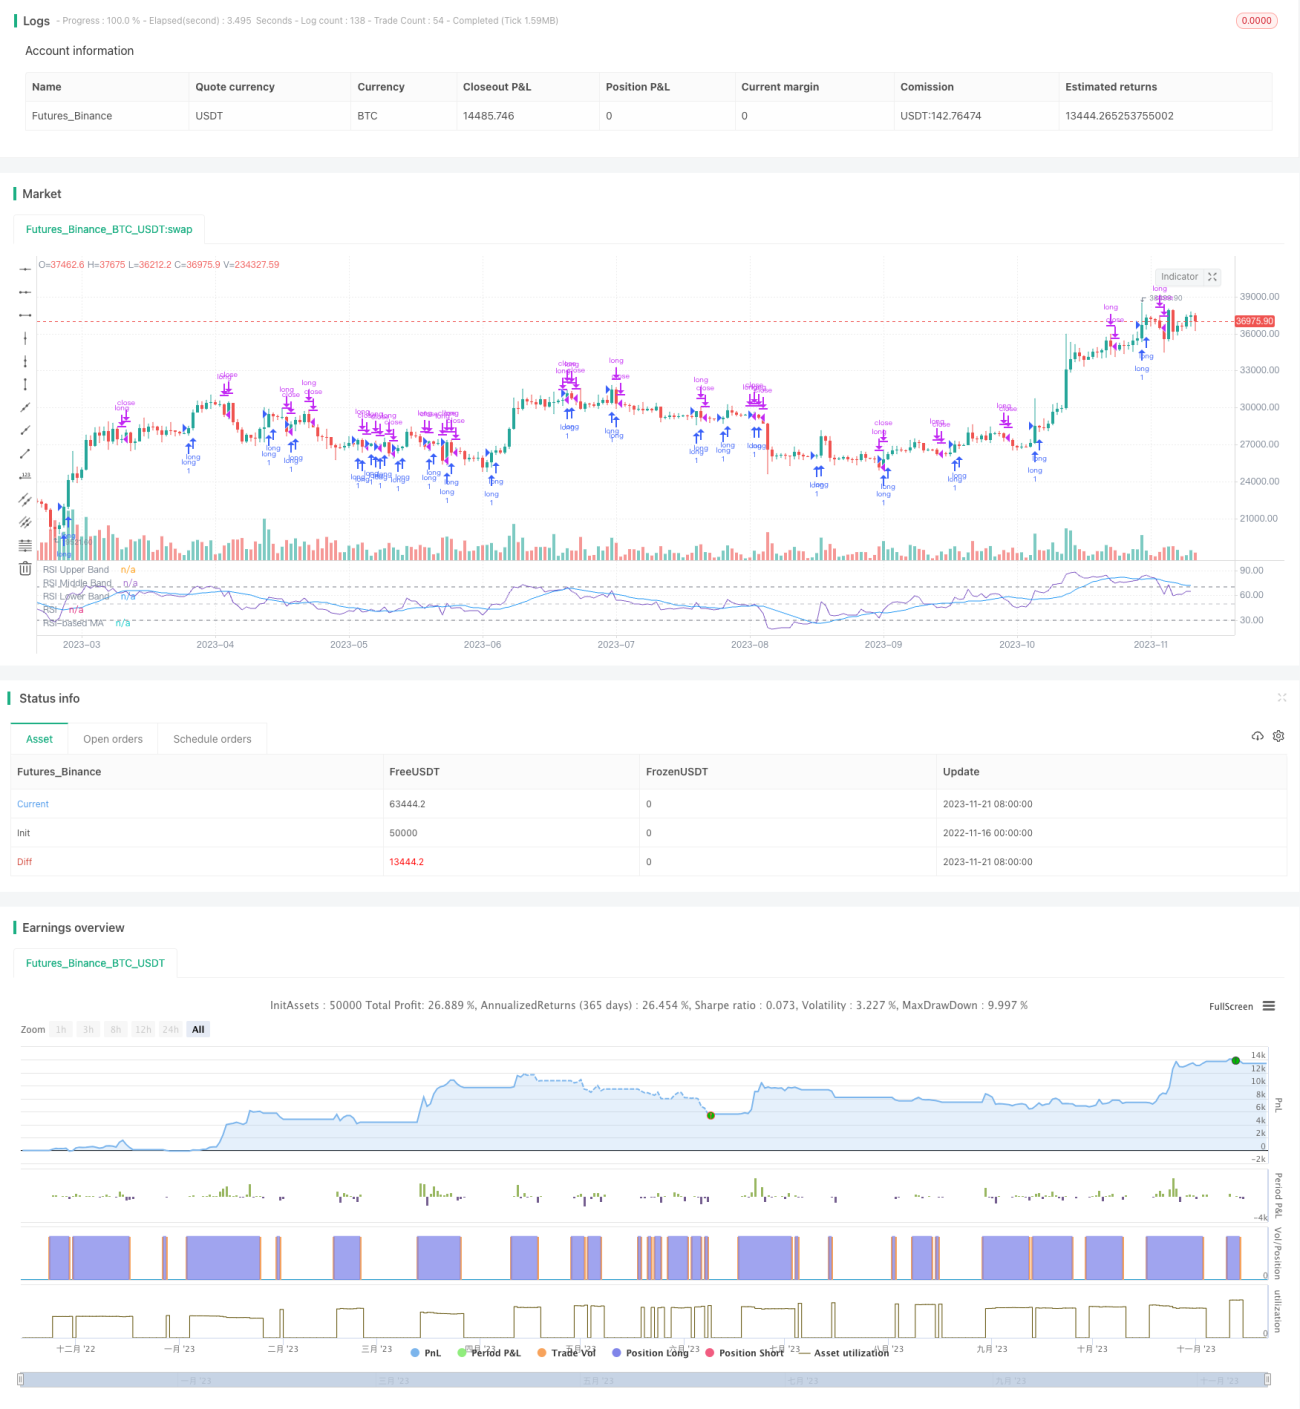
/*backtest
start: 2022-11-16 00:00:00
end: 2023-11-22 00:00:00
period: 1d
basePeriod: 1h
exchanges: [{"eid":"Futures_Binance","currency":"BTC_USDT"}]
*/

//@version=5
// Copyright (c) 2020-present, Alex Orekhov (everget)
// Corrected Moving Average script may be freely distributed under the terms of the GPL-3.0 license.
strategy('rsisma', shorttitle='rsisma')- 1