概述
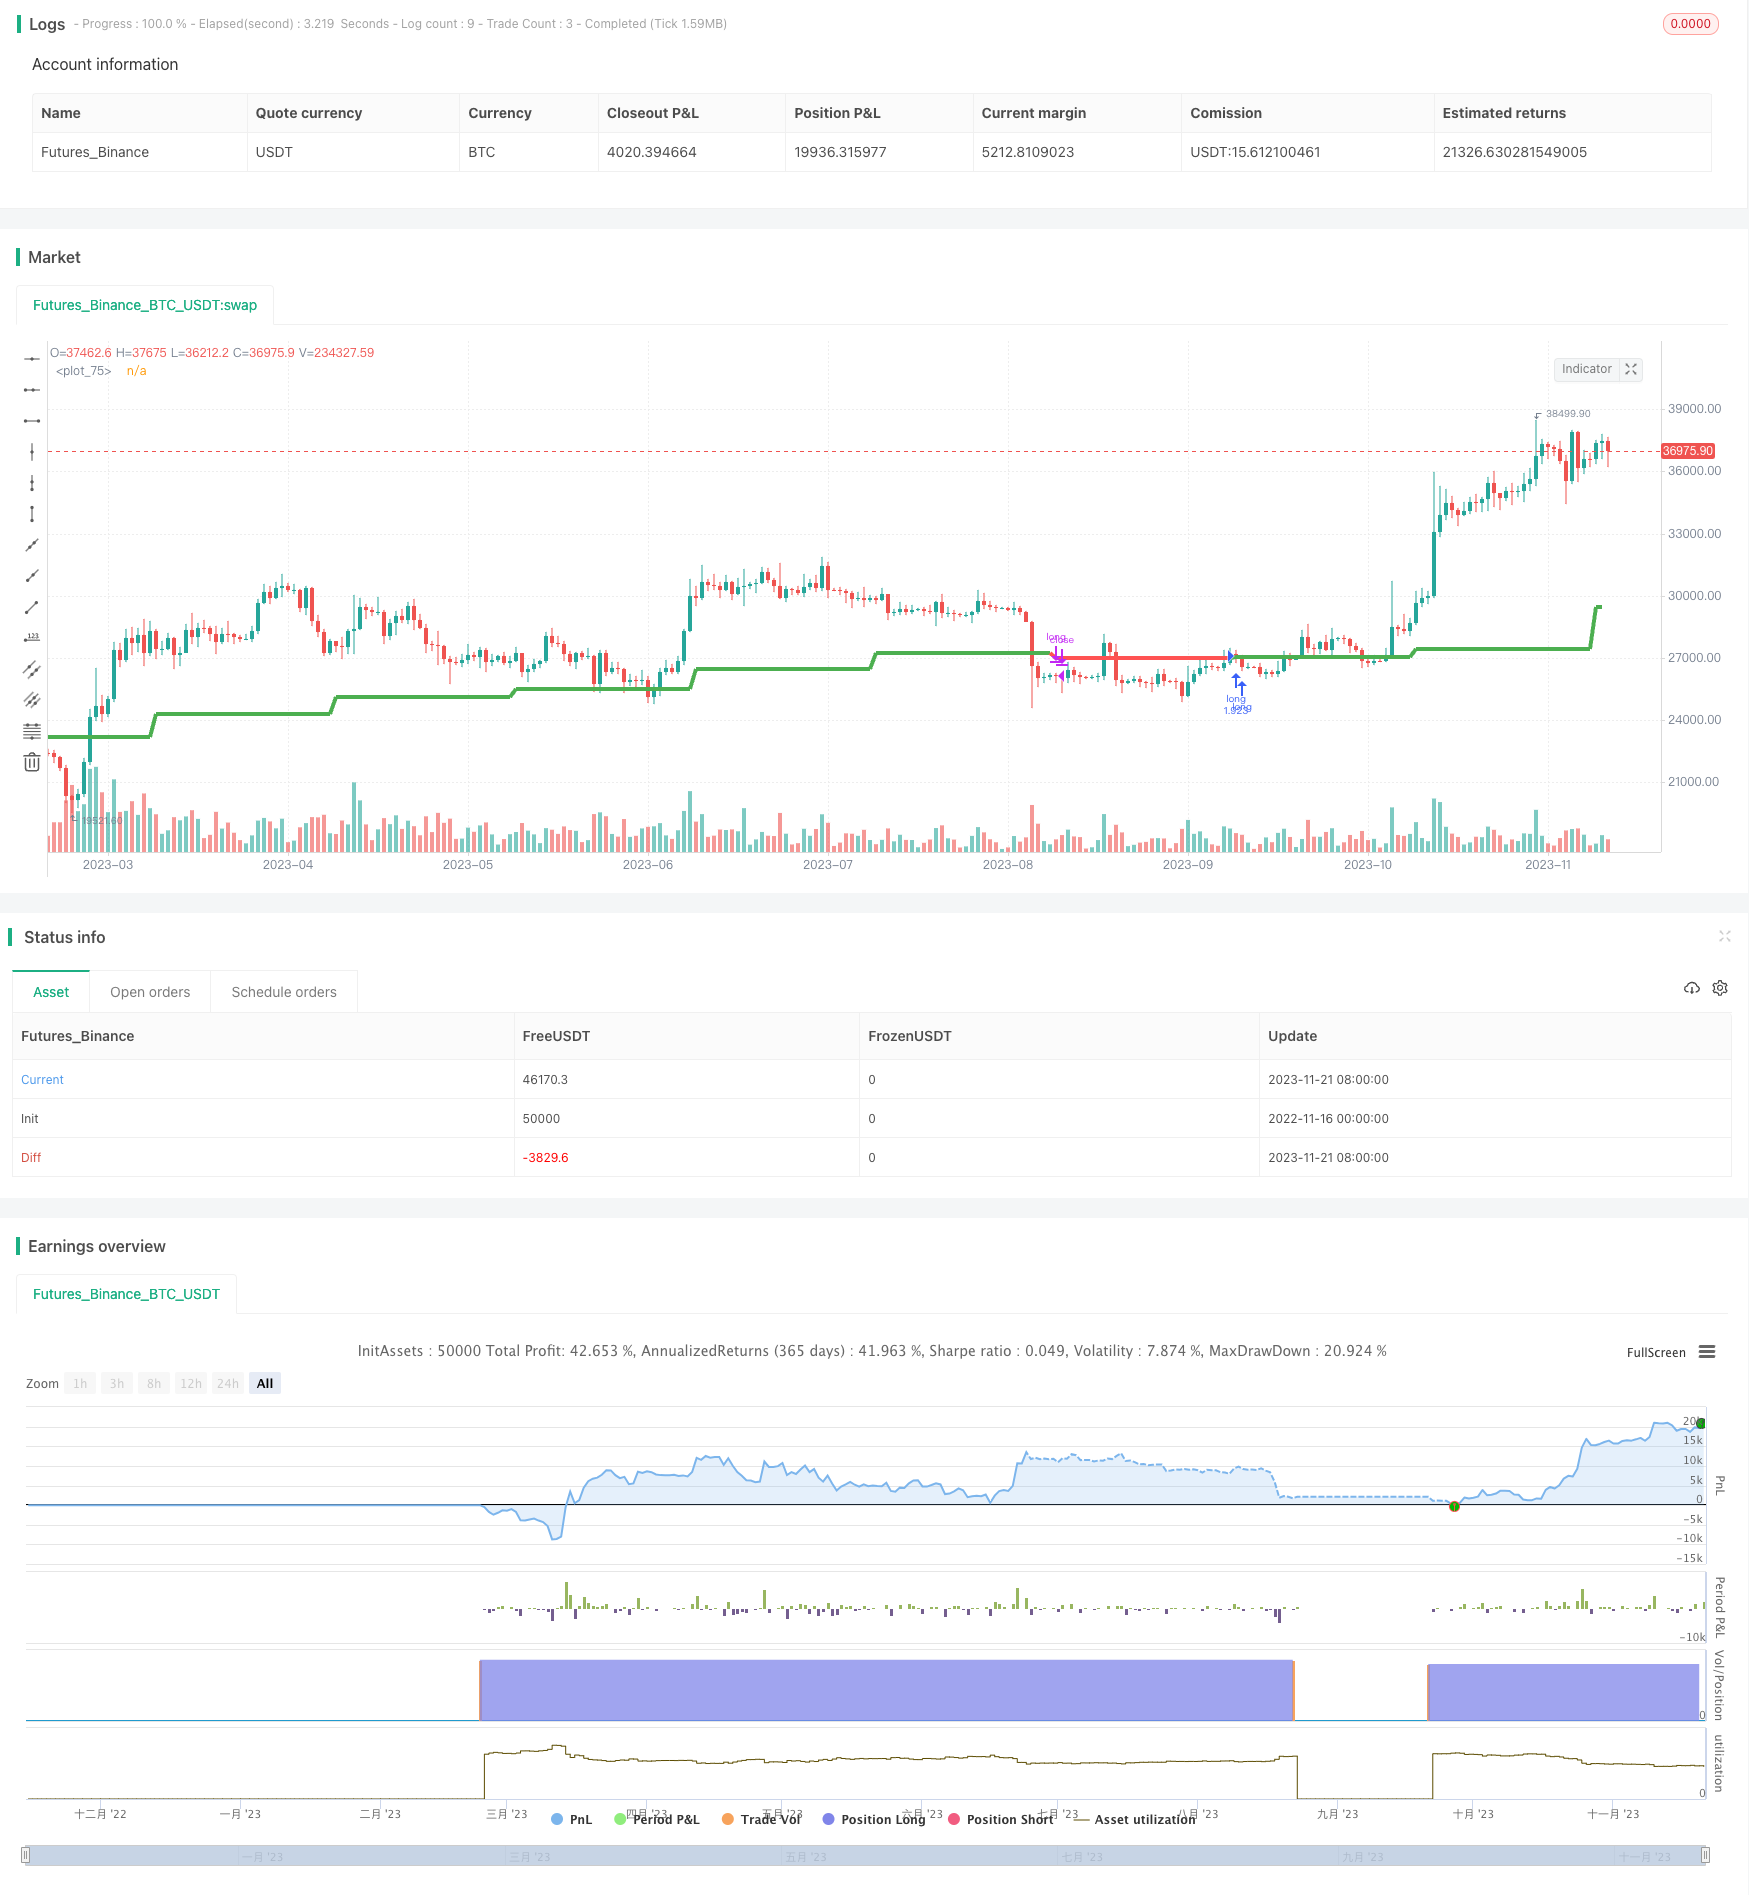
这个策略利用月线收盘价与移动均线的交叉来产生交易信号。当月线收盘价上穿移动均线时,做多;当月线收盘价下穿移动均线时,平仓。
策略原理
该策略的核心逻辑是:
- 输入移动均线的周期参数,可以选择SMA或EMA
- 可以选择显示移动均线
- 可以选择另一个股票的收盘价作为信号
- 根据月线收盘价和移动均线的关系判断交易信号
- 收盘价上穿移动均线,做多
- 收盘价下穿移动均线,平仓
该策略利用移动均线的平滑特性,过滤掉价格的部分噪音,捕捉股价中期趋势的转折。当股价上穿均线时,说明股价正在形成牛市趋势;当股价下穿均线时,说明股价趋势正在转为熊市。
策略优势
该策略有以下主要优势:
- 运用月线数据,能够有效过滤隔夜噪音,捕捉股价中长期趋势
- 可自定义移动均线周期,优化参数以适应不同股票
- 可选择另一个股票作为信号源,有利于提高稳定性
- 采用advanced anti-repainting技术,有效防止回溯
- 可输入任意回测时间周期,方便测试优化
总体来说,该策略框架简单实用,通过参数优化可以适用于大多数股票,特别适合中长线投资者。
策略风险
该策略也存在一些风险,主要集中在以下几个方面:
- 月线数据更新较慢,无法实时反映价格变化
- 存在一定的滞后,可能错过短线交易机会
- 移动均线具有滞后性,产生信号的时间点不可控
- 参数选择不当可能导致过于保守或错失机会
为了降低风险,可以从以下几个方面进行优化:
- 结合更低时间框架的技术指标进行辅助判断
- 调整移动均线周期,找到最佳参数组合
- 利用更稳定的标的作为信号源
- 适当调整仓位规模,控制单笔损失
策略优化方向
该策略还具有很大的优化空间,主要可以从以下几个方面进行优化:
- 增加止损策略,以锁定利润、控制风险
- 结合其他指标,如KD、MACD等,提高交易信号准确性
- 利用机器学习技术动态优化移动均线参数
- 增加仓位管理模块,让仓位随趋势allocatorsize变化
- 增设多空转换功能,可根据市场情况灵活调整
- joining与更低时间框架的K线,实现更灵敏的交易
总结
月线收盘价与移动均线交叉策略整体思路清晰、易于实现,通过参数调整可以适用于不同股票,特别适合中长线投资者。随着止损、优化参数等模块的不断加强,该策略可望产生更出色的表现。
策略源码
/*backtest
start: 2022-11-16 00:00:00
end: 2023-11-22 00:00:00
period: 1d
basePeriod: 1h
exchanges: [{"eid":"Futures_Binance","currency":"BTC_USDT"}]
*/

// This source code is subject to the terms of the Mozilla Public License 2.0 at https://mozilla.org/MPL/2.0/
// © universique

//@version=4
strategy("Monthly MA Close ", shorttitle="MMAC", overlay=true, default_qty_type =  strategy.percent_of_equity, default_qty_value = 100)
//MAY 6 2020 18:00

// No repaint function
// Function to securely and simply call `security()` so that it never repaints and never looks ahead.
f_secureSecurity(_symbol, _res, _src) => security(_symbol, _res, _src[1], lookahead = barmerge.lookahead_on)
//sec10 = f_secureSecurity(syminfo.tickerid, higherTf, data)

// ————— Converts current chart resolution into a float minutes value.
f_resInMinutes() =>
    _resInMinutes = timeframe.multiplier * (
      timeframe.isseconds ? 1. / 60             :
      timeframe.isminutes ? 1.                  :
      timeframe.isdaily   ? 60. * 24            :
      timeframe.isweekly  ? 60. * 24 * 7        :
      timeframe.ismonthly ? 60. * 24 * 30.4375  : na)
// ————— Returns the float minutes value of the string _res.
f_tfResInMinutes(_res) =>
    // _res: resolution of any TF (in "timeframe.period" string format).
    // Dependency: f_resInMinutes().
    security(syminfo.tickerid, _res, f_resInMinutes())

// —————————— Determine if current timeframe is smaller that higher timeframe selected in Inputs.
// Get higher timeframe in minutes.
//higherTfInMinutes = f_tfResInMinutes(higherTf)
// Get current timeframe in minutes.
currentTfInMinutes = f_resInMinutes()
// Compare current TF to higher TF to make sure it is smaller, otherwise our plots don't make sense.
//chartOnLowerTf = currentTfInMinutes < higherTfInMinutes

// Input
switch1=input(true, title="Show MA")
exponential = input(true, title="Exponential MA")
ticker = input(false, title="Other ticker MA")

tic_ma = input(title="Ticker MA", type=input.symbol, defval="BTC_USDT:swap")
res_ma = input(title="Time MA (W, D, [min])", type=input.string, defval="M")
len_ma = input(8, minval=1, title="Period MA")

ma_cus = exponential?f_secureSecurity(tic_ma, res_ma, ema(close,len_ma)) : f_secureSecurity(tic_ma, res_ma, sma(close,len_ma))
ma_long = exponential?f_secureSecurity(syminfo.tickerid, res_ma, ema(close,len_ma)) : f_secureSecurity(syminfo.tickerid, res_ma, sma(close,len_ma))

cl1 = f_secureSecurity(syminfo.tickerid, 'M', close)
cl2 = f_secureSecurity(tic_ma, 'M', close)

// Input Backtest Range
showDate  = input(defval = false, title = "Show Date Range", type = input.bool)
fromMonth = input(defval = 1,    title = "From Month",      type = input.integer, minval = 1, maxval = 12)
fromDay   = input(defval = 1,    title = "From Day",        type = input.integer, minval = 1, maxval = 31)
fromYear  = input(defval = 1995, title = "From Year",       type = input.integer, minval = 1850)
thruMonth = input(defval = 1,    title = "Thru Month",      type = input.integer, minval = 1, maxval = 12)
thruDay   = input(defval = 1,    title = "Thru Day",        type = input.integer, minval = 1, maxval = 31)
thruYear  = input(defval = 2112, title = "Thru Year",       type = input.integer, minval = 1850)

// Funcion Example
start     = timestamp(fromYear, fromMonth, fromDay, 00, 00)        // backtest start window
finish    = timestamp(thruYear, thruMonth, thruDay, 23, 59)        // backtest finish window
window()  => time >= start and time <= finish ? true : false       // create function "within window of time"

// Calculation
bullish_cross = ticker?cl2>ma_cus : cl1>ma_long
bearish_cross = ticker?cl2<ma_cus : cl1<ma_long

MAColor = bullish_cross ? color.green : bearish_cross ? color.red : color.orange

// Strategy
strategy.entry("long", strategy.long, when = window() and bullish_cross)
strategy.close("long", when = window() and bearish_cross)

// Output
plot(switch1?ma_long:na,color = MAColor,linewidth=4)

// Alerts
alertcondition(bullish_cross, title='Bullish', message='Bullish')
alertcondition(bearish_cross, title='Bearish', message='Bearish')