Multi-Period RSI Grid Trading Strategy

Overview
This strategy uses 7 RSI indicators with different timeframes to determine market trends and establish grid positions for efficient grid trading when the RSI indicators are fluctuating. The strategy is named "Multi-Period RSI Grid Trading Strategy", or "MPRSI Grid Strategy" for short.
Strategy Logic
-
The strategy uses 7 RSI indicators with different timeframes (1 minute, 5 minutes, 15 minutes, 30 minutes, 1 hour, 2 hours and 1 day). When all 7 RSI indicators are simultaneously lower than the overbought line, a buy signal is generated. When all 7 RSI indicators are simultaneously higher than the oversold line, a sell signal is generated.
-
Based on the buy and sell signals, 20 orders with fixed percentage price intervals are placed around the current price. For example, if the entry price is $100 and the interval between orders is 2%, the order prices would be $98, $96... down to $60.
-
When the price hits one of the order prices, an order is filled and a position is established. Profit taking occurs when a set percentage take profit is hit.
Advantages of the Strategy
-
Using multiple indicators avoids misinterpreting the market trend. The 7 timeframes cover short-term and medium-long term trend changes for accurate judgments.
-
The RSI indicator reliably identifies overbought and oversold levels, avoiding buying highs and selling lows.
-
Grid orders efficiently enter positions, avoiding chasing rallies and declines. Gradual entries across flat markets allows optimization of entry costs.
-
Take profit and stop loss settings aid risk management and reduce loss exposure during extreme moves.
Risks & Solutions
-
Sharp price moves could penetrate the grid. This can be addressed by reasonably setting grid intervals and adding to margins.
-
Stop losses placed too closely may incur unnecessary slippage costs. Reasonably wide stops based on volatility is optimal.
-
Some RSI indicators could generate incorrect signals. Filtering certain RSI timeframes can isolate the issues.
Optimization Directions
-
Different combinations of parameters and alternate judgment logics can be tested to refine entry and exit strategies.
-
Incorporate volatility metrics to automatically adjust grid intervals, with wider intervals during higher volatility environments.
-
Add capital management modules to dynamically alter maximum position sizing, grid intervals etc based on account equity.
Conclusion
This strategy combines multi-timeframe RSI indicators to determine market trends, efficiently establishing grid positions during ranging markets. The advantages of cost optimization, taking profits, cutting losses and risk controls make it suitable for traders seeking to capitalize on ranging markets while tolerating defined risks. Further refinements and optimizations are possible to suit specific risk appetites.
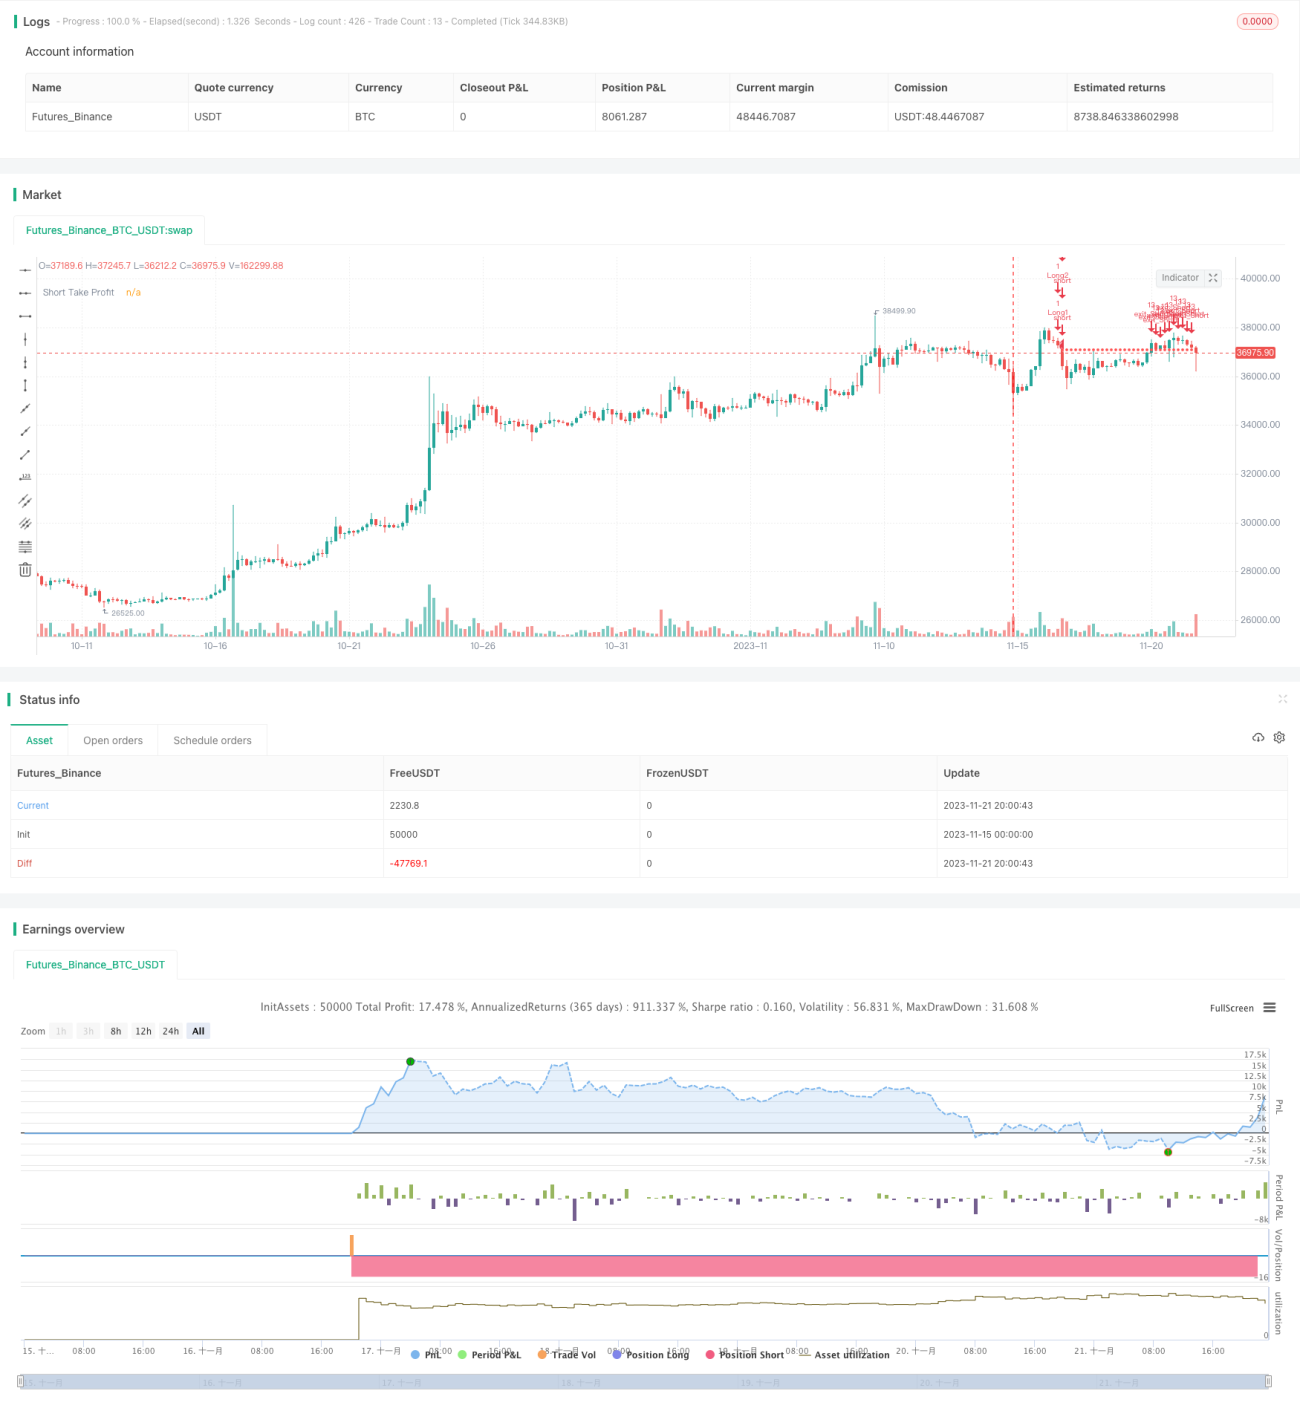
/*backtest
start: 2023-11-15 00:00:00
end: 2023-11-22 00:00:00
period: 4h
basePeriod: 15m
exchanges: [{"eid":"Futures_Binance","currency":"BTC_USDT"}]
args: [["MinLot",0.001,358374]]
*/

// This source code is subject to the terms of the Mozilla Public License 2.0 at https://mozilla.org/MPL/2.0/
// © rrolik66
- 1