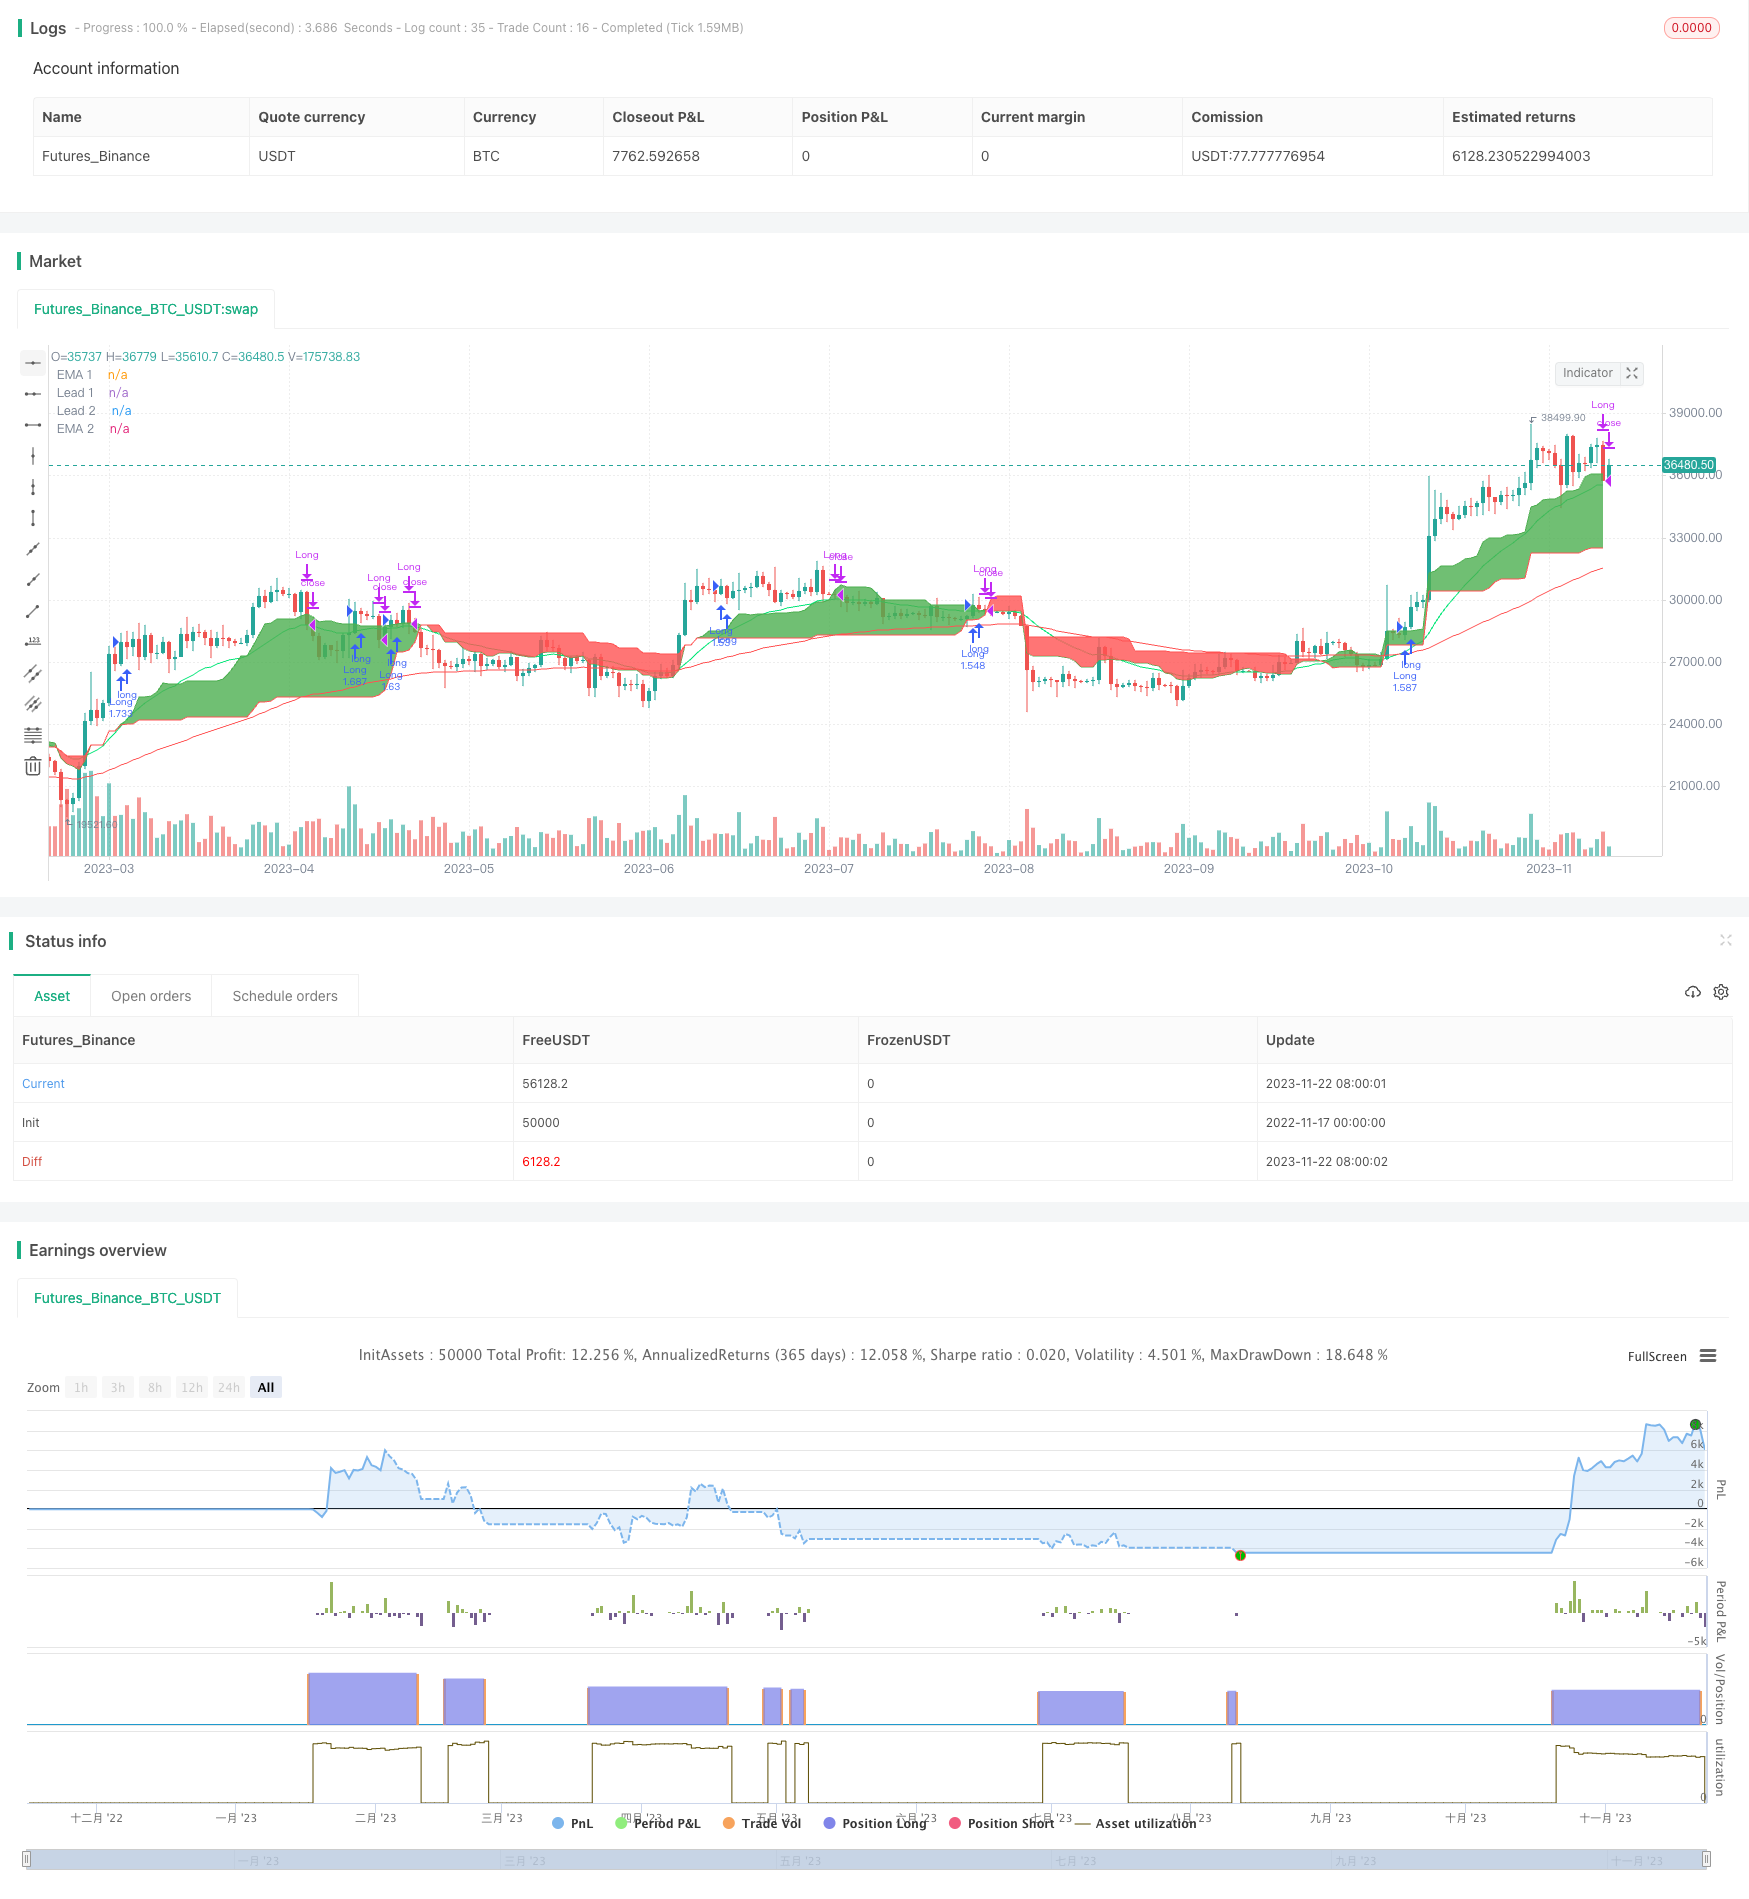
概述
这是一个仅做多的Ichimoku云图量化策略。策略通过Ichimoku指标判断趋势方向,配合K线形态、移动平均线和 Stochastic RSI 指标过滤信号,在趋势向上时选择较好的入场点做多。
策略原理
该策略主要判断标准如下:
- Ichimoku先导线1上穿先导线2,表示趋势转多
- K线收盘价上穿先导线1,符合追踪趋势的条件
- K线为阳线,趋势向上
- 启用移动平均线时,要求快线上穿慢线
- 启用Stochastic RSI时,要求K线上穿D线
当以上条件同时满足时,策略会开仓做多;当价格跌破先导线1时,策略会平仓离场。
该策略主要利用Ichimoku云图判断主趋势方向,再结合辅助指标过滤信号,在趋势向上时选择较好点位入场。
策略优势
- 利用Ichimoku云图判断主趋势,回测表明其判断准确率很高
- 结合多种辅助指标过滤入场点位,可显著提高获利率
- 仅做多策略,适用于判断为多头行情的币种
- 参数优化空间大,可调整指标参数进一步优化
策略风险
- Ichimoku云图判断失败的概率存在,可能误判趋势方向
- 行情突变时止损点可能被突破,导致亏损扩大
- 针对多头行情设计,不适合行情暗藏转势迹象的币种
- 参数设置不当可能导致过于激进入场或过于保守
对策:
- 结合更多指标判断趋势,提高判断准确率
- 设置合理止损点,严格控制单笔亏损
- 根据不同币种行情选择适用策略
- 仔细测试与优化参数,使策略更稳定
策略优化方向
- 优化辅助指标参数设置,进一步提高策略稳定性
- 增加止损机制,例如追踪止损、指数移动平均线止损等
- 增加仓位管理,例如固定仓位、仓位平均等
- 针对具体币种进行参数调整优化
总结
该Ichimoku云图量化策略通过判断趋势方向,实现高胜率且风险可控的仅多头做单策略。策略优势明显,在多头行情中效果突出。下一步可从指标优化、止损机制、仓位管理等方面进行改进,使策略更加完善稳定。
策略源码
/*backtest
start: 2022-11-17 00:00:00
end: 2023-11-23 00:00:00
period: 1d
basePeriod: 1h
exchanges: [{"eid":"Futures_Binance","currency":"BTC_USDT"}]
*/

//@version=4

strategy(title="Ichimoku only Long Strategy", shorttitle="Ichimoku only Long", overlay = true, pyramiding = 0, calc_on_order_fills = false, commission_type =  strategy.commission.percent, commission_value = 0, default_qty_type = strategy.percent_of_equity, default_qty_value = 100, initial_capital=10000, currency=currency.USD)

// Time Range
FromMonth=input(defval=1,title="FromMonth",minval=1,maxval=12)
FromDay=input(defval=1,title="FromDay",minval=1,maxval=31)
FromYear=input(defval=2017,title="FromYear",minval=2017)
ToMonth=input(defval=1,title="ToMonth",minval=1,maxval=12)
ToDay=input(defval=1,title="ToDay",minval=1,maxval=31)
ToYear=input(defval=9999,title="ToYear",minval=2017)
start=timestamp(FromYear,FromMonth,FromDay,00,00)
finish=timestamp(ToYear,ToMonth,ToDay,23,59)
window()=>true
// See if this bar's time happened on/after start date
afterStartDate = time >= start and time<=finish?true:false

//Enable RSI
enableema = input(true, title="Enable EMA?")
enablestochrsi = input(false, title="Enable Stochastik RSI?")

//EMA
emasrc = close,
len1 = input(24, minval=1, title="EMA 1")
len2 = input(90, minval=1, title="EMA 2")

ema1 = ema(emasrc, len1)
ema2 = ema(emasrc, len2)

col1 = color.lime
col2 = color.red

//EMA Plots
plot(ema1, title="EMA 1", linewidth=1, color=col1)
plot(ema2, title="EMA 2", linewidth=1, color=col2)

//STOCH RSI
smoothK = input(3, minval=1, title="RSI K Line")
smoothD = input(3, minval=1, title="RSI D Line")
lengthRSI = input(14, minval=1, title="RSI Length")
lengthStoch = input(14, minval=1, title="Stochastik Length")
src = input(close, title="RSI Source")

rsi1 = rsi(src, lengthRSI)
k = sma(stoch(rsi1, rsi1, rsi1, lengthStoch), smoothK)
d = sma(k, smoothD)

//Ichimoku
conversionPeriods = input(9, minval=1, title="Ichi Conversion Line Length")
basePeriods = input(26, minval=1, title="Ichi Base Line Length")
laggingSpan2Periods = input(52, minval=1, title="Ichi Lagging Span 2 Length")
displacement = input(1, minval=0, title="Ichi Displacement")
donchian(len) => avg(lowest(len), highest(len))
conversionLine = donchian(conversionPeriods)
baseLine = donchian(basePeriods)
leadLine1 = avg(conversionLine, baseLine)
leadLine2 = donchian(laggingSpan2Periods)
p1 = plot(leadLine1, offset = displacement - 1, color=color.green,
	 title="Lead 1")
p2 = plot(leadLine2, offset = displacement - 1, color=color.red,
	 title="Lead 2")
fill(p1, p2, color = leadLine1 > leadLine2 ? color.green : color.red)


//Long Condition
crossup = k[0] > d[0] and k[1] <= d[1]
ichigreenabovered = leadLine1 > leadLine2
ichimokulong = close > leadLine1
greencandle =  close > open
redcandle = close < open
emacond = ema1 > ema2
longcondition = ichigreenabovered and ichimokulong and greencandle

//Exit Condition
ichimokuexit = close < leadLine1

exitcondition = ichimokuexit and redcandle

//Entrys

if (enablestochrsi == false) and (enableema == false) and (longcondition) and (afterStartDate) and (strategy.opentrades < 1)
    strategy.entry("Long", strategy.long)

if (enablestochrsi == true) and (enableema == false) and (longcondition) and (crossup) and (afterStartDate) and (strategy.opentrades < 1)
    strategy.entry("Long", strategy.long)

if (enableema == true) and (enablestochrsi == false) and (longcondition) and (emacond) and (afterStartDate) and (strategy.opentrades < 1)
    strategy.entry("Long", strategy.long)

if (enableema == true) and (enablestochrsi == true) and (longcondition) and (emacond) and (crossup) and (afterStartDate) and (strategy.opentrades < 1)
    strategy.entry("Long", strategy.long)


//Exits
if (afterStartDate)
    strategy.close(id = "Long", when = exitcondition)