Trend Following Strategy Based on Time Series Decomposition and Volume Weighted Bollinger Bands

1
Follow
1779
Followers
Overview
This strategy integrates time series decomposition, volume weighted average price, Bollinger Bands and delta(OBV-PVT) 4 technical indicators to make multidimensional judgments on price trends, overbought and oversold conditions.
Principles
- Use time series decomposition to remove noise and periodicity in prices for more accurate trend judgment;
- Calculate volume weighted new price based on the trend line;
- Calculate the Bollinger Bands Percentage Width (BB%B) of closing price to determine overbought and oversold conditions;
- Calculate the BB%B of Delta(OBV-PVT) as a measure of price-volume divergence;
- Generate trading signals based on price-volume indicators crosses and Bollinger Bands overshoots and undershoots.
Advantages
- Combines price, volume and statistical features for robust judgments;
- BB%B combined with Delta(OBV-PVT) better identifies short-term overbought/oversold conditions;
- Price-volume crossover signals filter out some false signals.
Risks
- Too complex parameter tuning;
- Short-term choppiness may increase losses;
- Price-volume divergences do not completely filter false signals.
Parameters like moving averages, Bollinger Bands widths and risk-reward ratios can be optimized to reduce trading frequency while improving risk-adjusted returns per trade.
Conclusion
Integrating tools like time series decomposition, Bollinger Bands, OBV indicators, this strategy combines price-volume relationships, statistical properties and trend analysis to identify short-term reversals and catch major trends. There are also certain risks that need to be addressed through parameter tuning for optimal performance.
Source
Pine
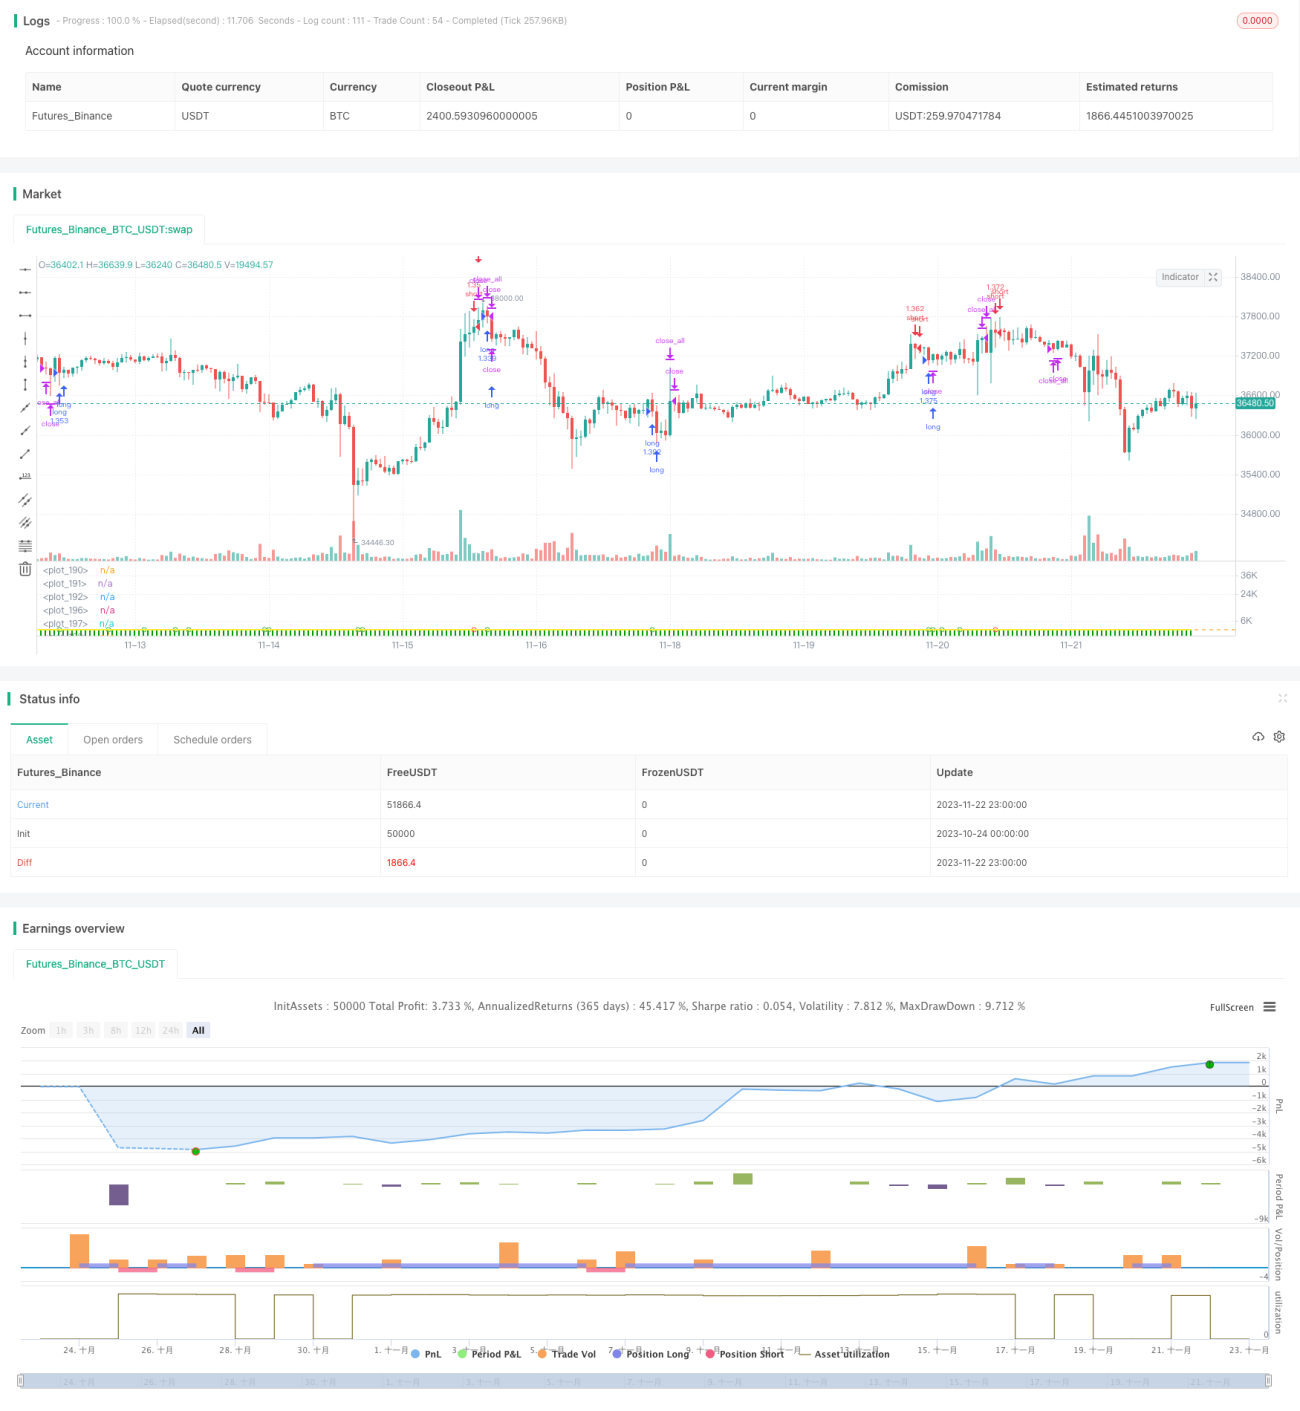
/*backtest
start: 2023-10-24 00:00:00
end: 2023-11-23 00:00:00
period: 1h
basePeriod: 15m
exchanges: [{"eid":"Futures_Binance","currency":"BTC_USDT"}]
*/

// This source code is subject to the terms of the Mozilla Public License 2.0 at https://mozilla.org/MPL/2.0/
//// This source code is subject to the terms of the Mozilla Public License 2.0 at https://mozilla.org/MPL/2.0/
// © oakwhiz and tathal
Strategy parameters
Related strategies
Comment
All comments (0)
No data
- 1