概述
一目均衡策略是一个利用Ichimoku Kinko Hyo指标实现的趋势跟踪策略。该策略结合多种指标识别趋势方向,在牛市中做多,在熊市中做空,实现资金的长期增值。
策略原理
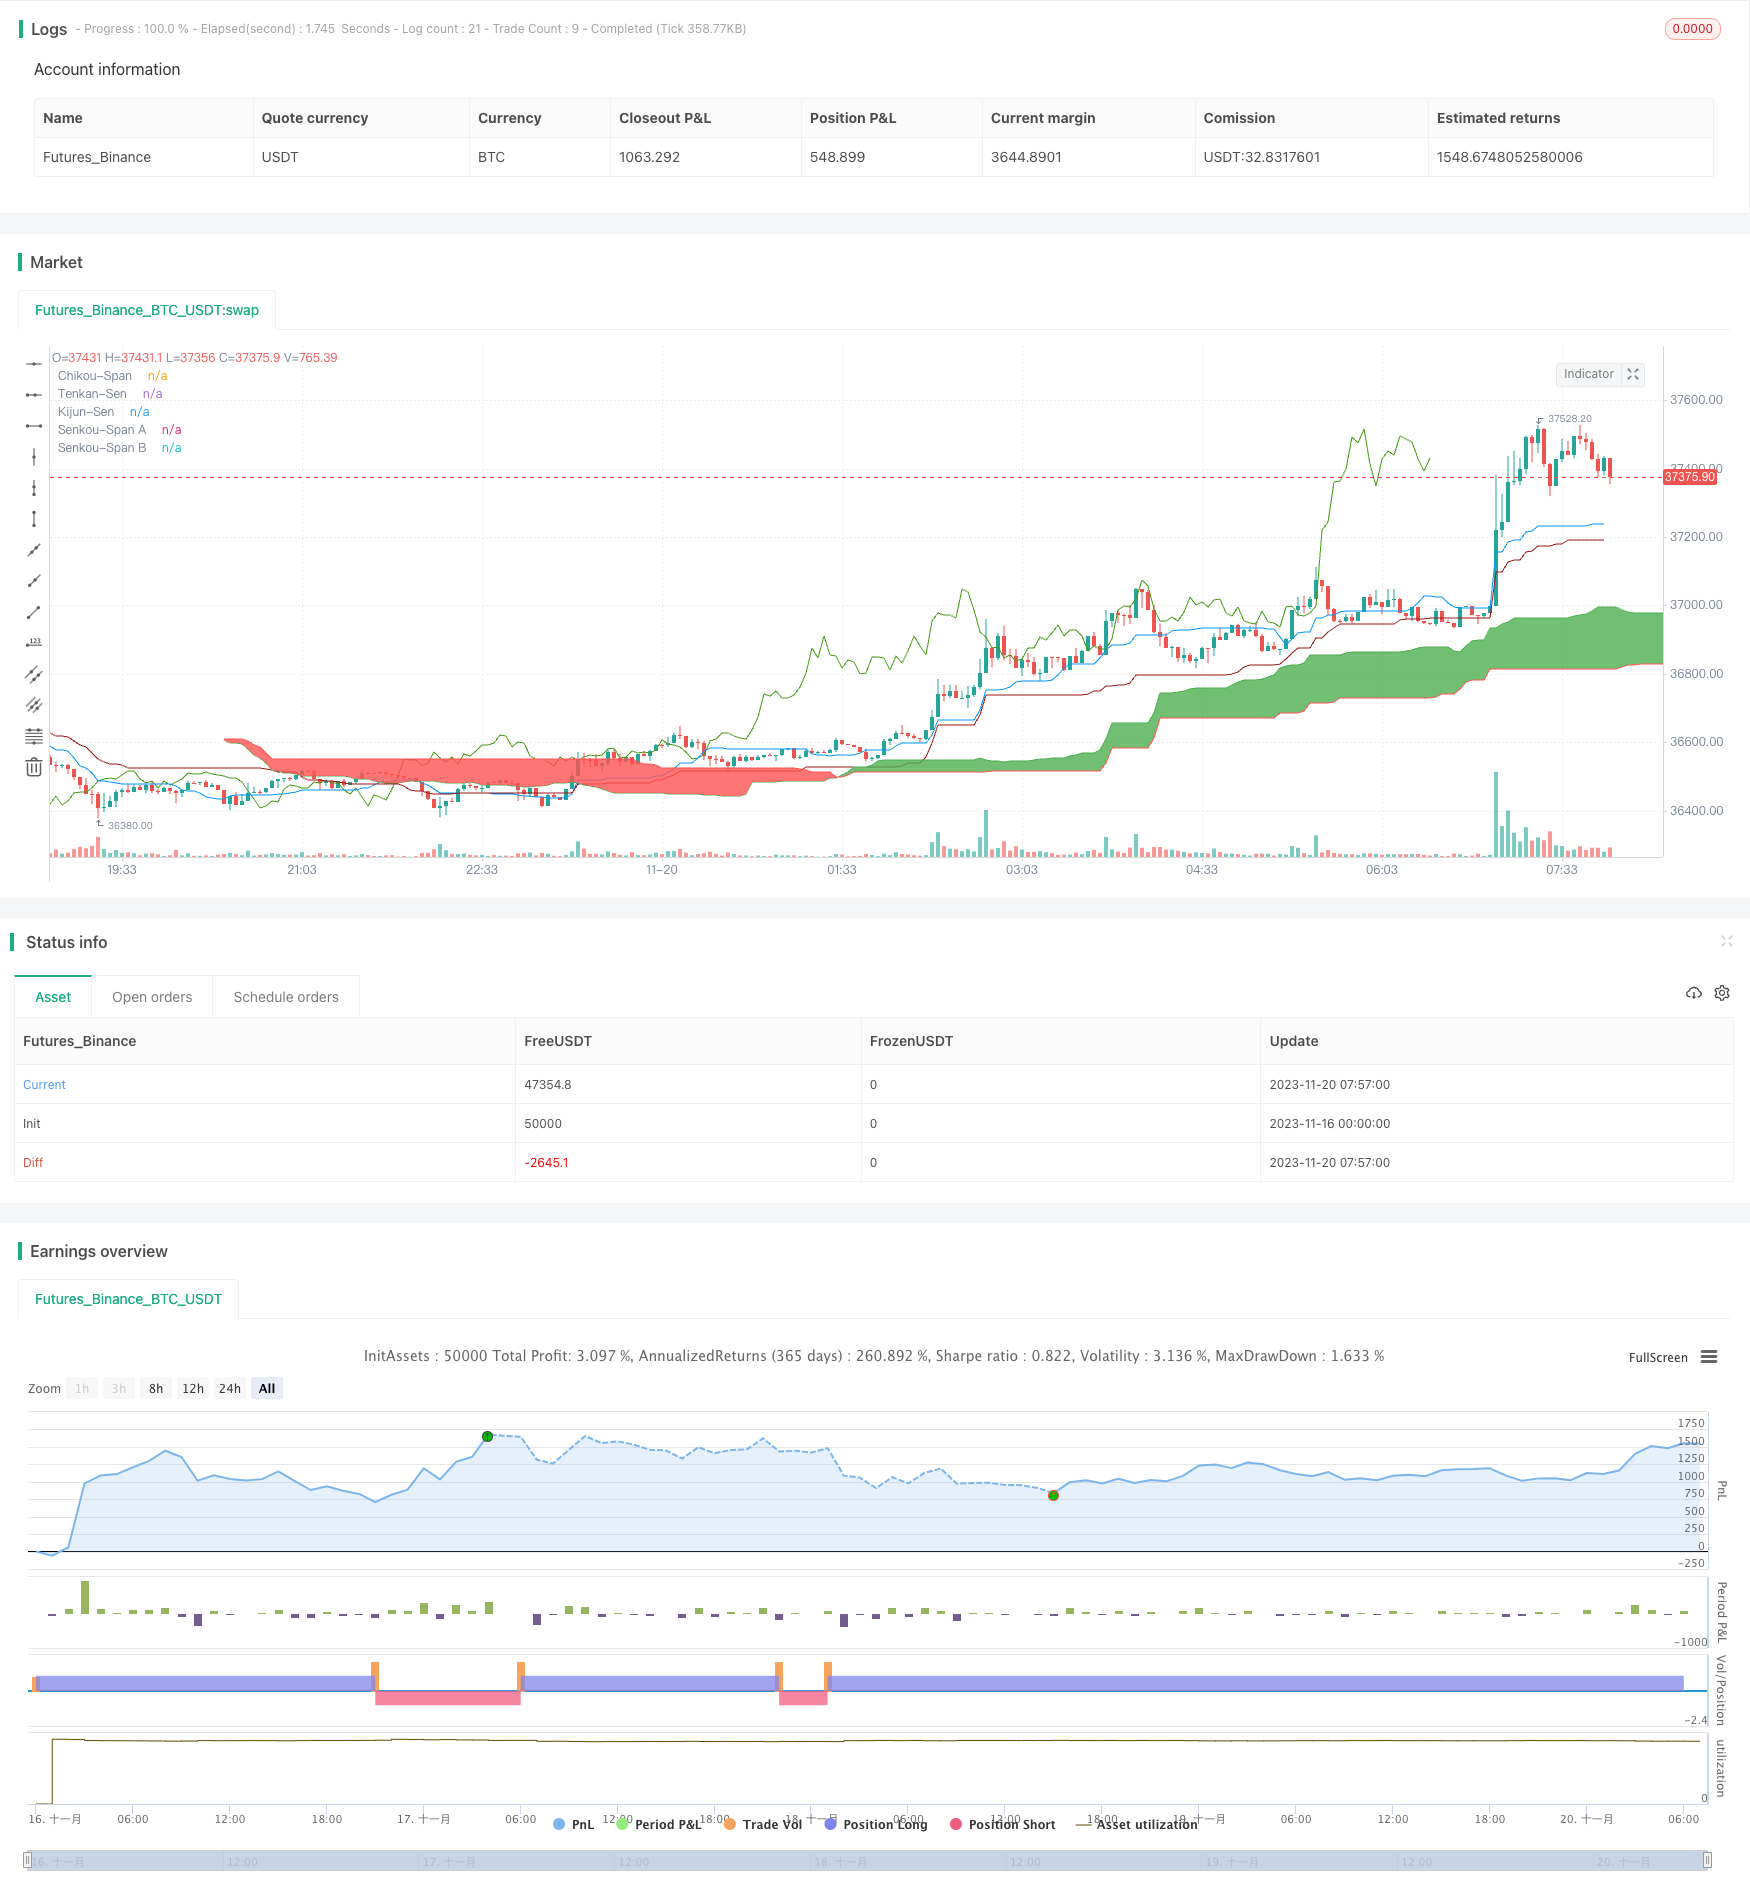
该策略主要基于Ichimoku Kinko Hyo指标。该指标由转向线(Tenkan-Sen)、基准线(Kijun-Sen)、前沿线(Senkou-Span A)、先行线(Senkou-Span B)和延迟线(Chikou-Span)组成。当价格在云图之上时为多头趋势,当价格在云图之下时为空头趋势。
该策略的交易信号来自以下条件的组合:
- 转向线上穿基准线为多头信号
- 转向线下穿基准线为空头信号
- 延迟线向上穿越为多头确认
- 延迟线向下穿越为空头确认
- RSI指标高于50为多头指标
- RSI指标低于50为空头指标
- 价格在云图之上为多头趋势
- 价格在云图之下为空头趋势
当上述多头条件同时满足时,做多入场;当上述空头条件同时满足时,做空入场。
优势分析
该策略结合趋势跟踪和超买超卖指标,能够有效识别趋势的方向。主要优势如下:
- Ichimoku Kinko Hyo指标能够识别中长期趋势,避免被短期市场噪音误导。
- 结合RSI指标可以有效判断超买超卖区域,防止错过反转机会。
- 考虑了股价波动率条件,只在波动率较高时出手,避免无效交易。
- 严格的入场和出场机制,最大程度规避风险。
风险分析
该策略也存在一些风险需要注意:
- Ichimoku Kinko Hyo指标存在滞后,可能导致入场时机偏晚。
- 多条件组合交易信号出现的频率较低,容易导致交易次数不足。
- 未考虑资金管理和仓位管理,可能存在超量交易的风险。
对应解决方法:
- 适当缩短Ichimoku Kinko Hyo参数,提高指标的灵敏度。
- 降低入场条件严格度,增加交易频率。
- 加入资金管理和仓位管理模块,控制单笔交易资金占比和仓位。
优化方向
该策略可以从以下几个方向进行优化:
- 更换或组合其他指标,如KDJ、MACD等,丰富信号来源。
- 优化Ichimoku Kinko Hyo 参数,提高指标灵敏度。
- 加入止损策略,以锁定利润和控制风险。
- 增加仓位管理模块,根据资金规模动态调整仓位。
- 增加期货套期保值模块,管理多头套期保值风险。
总结
一目均衡策略整体是一个可靠、稳健的趋势跟踪策略。它解决了趋势交易中的重要问题——识别趋势准确度和 trades 生成频率之间的平衡。通过参数调整和模块扩展仍有优化空间,是可以长期运用的策略之一。
策略源码
/*backtest
start: 2023-11-16 00:00:00
end: 2023-11-20 08:00:00
period: 3m
basePeriod: 1m
exchanges: [{"eid":"Futures_Binance","currency":"BTC_USDT"}]
*/

//@version=4
strategy("Ichimoku Kinko Hyo: ETH 3h Strategy by tobuno", overlay=true)

//Inputs
ts_bars = input(22, minval=1, title="Tenkan-Sen Bars")
ks_bars = input(60, minval=1, title="Kijun-Sen Bars")
ssb_bars = input(120, minval=1, title="Senkou-Span B Bars")
cs_offset = input(30, minval=1, title="Chikou-Span Offset")
ss_offset = input(30, minval=1, title="Senkou-Span Offset")
long_entry = input(true, title="Long Entry")
short_entry = input(true, title="Short Entry")

//Volatility
vollength = input(defval=2, title="VolLength")
voltarget = input(defval=0.2, type=float, step=0.1, title="Volatility Target")
Difference = abs((close - open)/((close + open)/2) * 100)
MovingAverage = sma(Difference, vollength)
highvolatility = MovingAverage > voltarget

////////////////////////////////////////////////////////////////////////////////
// BACKTESTING RANGE

// From Date Inputs
fromDay = input(defval = 1, title = "From Day", minval = 1, maxval = 31)
fromMonth = input(defval = 1, title = "From Month", minval = 1, maxval = 12)
fromYear = input(defval = 2019, title = "From Year", minval = 1970)

// To Date Inputs
toDay = input(defval = 31, title = "To Day", minval = 1, maxval = 31)
toMonth = input(defval = 12, title = "To Month", minval = 1, maxval = 12)
toYear = input(defval = 2020, title = "To Year", minval = 1970)

// Calculate start/end date and time condition
startDate = timestamp(fromYear, fromMonth, fromDay, 00, 00)
finishDate = timestamp(toYear, toMonth, toDay, 00, 00)
time_cond = true

////////////////////////////////////////////////////////////////////////////////

middle(len) => avg(lowest(len), highest(len))

// Ichimoku Components
tenkan = middle(ts_bars)
kijun = middle(ks_bars)
senkouA = avg(tenkan, kijun)
senkouB = middle(ssb_bars)

//RSI
change = change(close)
gain = change >= 0 ? change : 0.0
loss = change < 0 ? (-1) * change : 0.0
avgGain = rma(gain, 14)
avgLoss = rma(loss, 14)
rs = avgGain / avgLoss
rsi = 100 - (100 / (1 + rs))

// Plot Ichimoku Kinko Hyo
plot(tenkan, color=#0496ff, title="Tenkan-Sen")
plot(kijun, color=#991515, title="Kijun-Sen")
plot(close, offset=-cs_offset+1, color=#459915, title="Chikou-Span")
sa=plot(senkouA, offset=ss_offset-1, color=green, title="Senkou-Span A")
sb=plot(senkouB, offset=ss_offset-1, color=red, title="Senkou-Span B")
fill(sa, sb, color = senkouA > senkouB ? green : red, title="Cloud color")

ss_high = max(senkouA[ss_offset-1], senkouB[ss_offset-1])
ss_low = min(senkouA[ss_offset-1], senkouB[ss_offset-1])

// Entry/Exit Signals
tk_cross_bull = tenkan > kijun
tk_cross_bear = tenkan < kijun
cs_cross_bull = mom(close, cs_offset-1) > 0
cs_cross_bear = mom(close, cs_offset-1) < 0
price_above_kumo = close > ss_high
price_below_kumo = close < ss_low
rsi_bullish = rsi > 50
rsi_bearish = rs < 50
bullish = tk_cross_bull and cs_cross_bull and price_above_kumo and rsi_bullish and highvolatility
bearish = tk_cross_bear and cs_cross_bear and price_below_kumo and rsi_bearish and highvolatility

strategy.entry("Long", strategy.long, when=bullish and long_entry and time_cond)
strategy.entry("Short", strategy.short, when=bearish and short_entry and time_cond)

strategy.close("Long", when=bearish and not short_entry and time_cond)
strategy.close("Short", when=bullish and not long_entry and time_cond)