概述
这个策略结合了KDJ指标和RSI指标来确定买入卖出的时机。它在KDJ指标和RSI指标发出买入/卖出信号时发出交易信号。
策略原理
该策略使用KDJ指标和RSI指标的交叉来判断买入和卖出时机。
具体来说,当KDJ的J线从下方向上穿过K线时视为买入信号,而当J线从上方向下穿过K线时则为卖出信号。这表示股票从超卖状态转为超买状态时买入,从超买状态转为超卖状态时卖出。
同时,该策略结合RSI指标判断强弱信号。RSI小于30为超卖,RSI大于70为超买。当KDJ发出买入信号时,若RSI指标也显示为超卖,则增强买入信号的可靠性。相反,当KDJ发出卖出信号时,若RSI也显示为超买,则增强卖出信号的可靠性。
综上,该策略在以下情况发出交易信号:
买入信号:
1. KDJ的J线向上穿过K线 且 RSI(6期) < RSI(12期)
2. KDJ的J线向上穿过K线 且 RSI(6期)穿过RSI(24期)
3. RSI(6期)穿过RSI(24期) 且 RSI(6期)< 40
卖出信号:
1. KDJ的J线向下穿过K线 且 RSI(6期) > RSI(12期)
2. KDJ的J线向下穿过K线 且 RSI(6期)穿过RSI(24期)
3. RSI(6期)穿过RSI(24期) 且 RSI(6期)> 60
策略优势
结合KDJ指标和RSI指标,使交易信号更加可靠。
KDJ指标判断超买超卖状态,RSI指标判断强弱状态,两者结合可以更好抓住转折点。
多种买入/卖出条件的组合,避免因单一指标原因而错失良机。
RSI的参数设置为6期、12期和24期三组参数,这些参数适用于不同周期级别,使策略适用面更广。
风险分析
KDJ指标和RSI指标都可能出现假信号,从而引发不必要的交易。
多重交易条件增加了策略操作的复杂度,需要仔细验证。
该策略还需在不同的市场中测试优化,对参数也需要调整。
策略优化
可以测试添加其他指标,如布林线,强化交易信号。
可以优化KDJ指标和RSI指标的参数,使其更符合不同周期级别。
可以通过提高止损标准来控制风险。
可以添加自动止损机制。当价格反向运行时自动止损。
总结
该策略结合KDJ指标和RSI指标的优点,通过双重指标的交叉来判断买入和卖出时机,增强了交易信号的准确性。同时结合不同参数的RSI指标判定多空状态,使策略适用面更广。该策略有效避免了单一指标可能带来的假信号风险。通过优化参数设置及添加辅助指标或止损机制等进行改进,该策略的效果还可进一步提升。
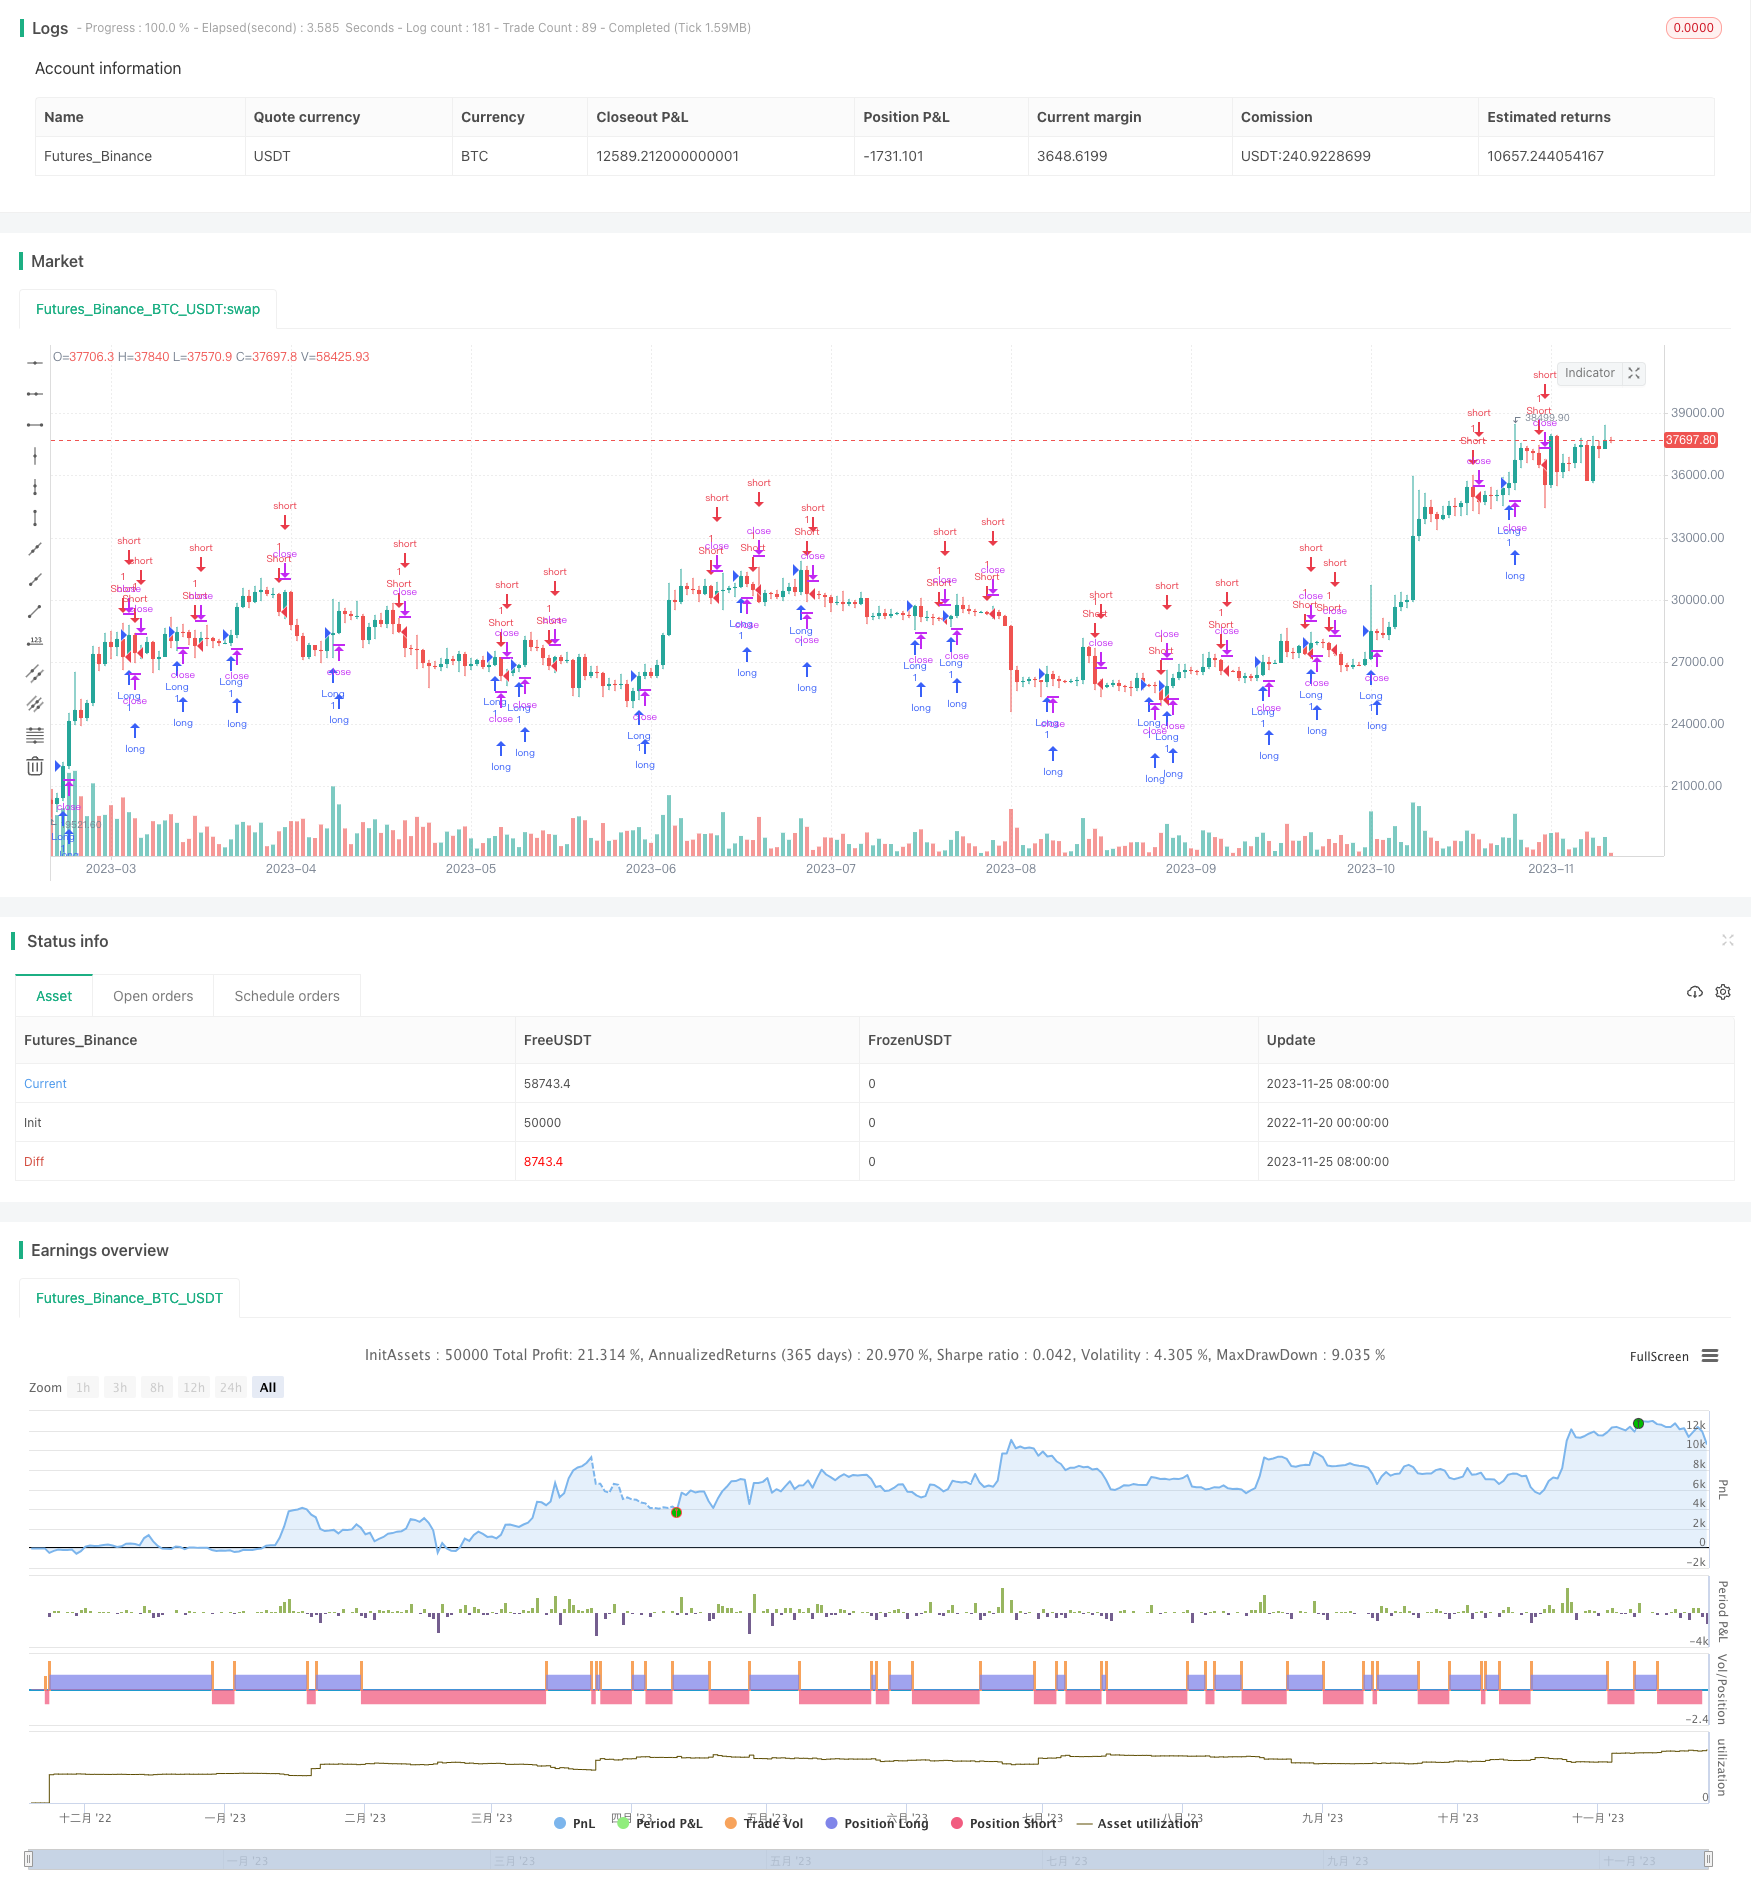
/*backtest
start: 2022-11-20 00:00:00
end: 2023-11-26 00:00:00
period: 1d
basePeriod: 1h
exchanges: [{"eid":"Futures_Binance","currency":"BTC_USDT"}]
*/

// This source code is subject to the terms of the Mozilla Public License 2.0 at https://mozilla.org/MPL/2.0/
// © innocentChart76064

//@version=5
strategy(title = "buy/sell KDJ RSI", overlay=true)

//Define KDJ parameter
kdj_length = input(9, title = "KDJ length")
signal = input(3,title="signal")

// Calculate KDJ values
bcwsma(s,l,m) =>
    _bcwsma = float(na)
    _s = s
    _l = l
    _m = m
    _bcwsma := (_m*_s+(_l-_m)*nz(_bcwsma[1]))/_l
    _bcwsma

c = close
h = ta.highest(high, kdj_length)
l = ta.lowest(low,kdj_length)
RSV = 100*((c-l)/(h-l))
kdj_k = bcwsma(RSV, signal, 1)
kdj_d = bcwsma(kdj_k, signal, 1)
kdj_j = 3 * kdj_k-2 * kdj_d

//Define RSI parameter
rsi_length_1 = input(6)
rsi_length_2 = input(12)
rsi_length_3 = input(24)
price = close

//Calculate RSI values
rsi_1 = ta.rsi(price, rsi_length_1)
rsi_2 = ta.rsi(price, rsi_length_2)
rsi_3 = ta.rsi(price, rsi_length_3)

// Trading conditions
longCondition = ta.crossover(kdj_j,kdj_k) and rsi_1 > rsi_2 or ta.crossover(kdj_j,kdj_k) and ta.crossover(rsi_1,rsi_3) or ta.crossover(rsi_1,rsi_3) and rsi_1<40
shortCondition = ta.crossunder(kdj_j,kdj_k) and rsi_1 < rsi_2 or ta.crossunder(kdj_j,kdj_k) and ta.crossunder(rsi_1,rsi_3) or ta.crossunder(rsi_1,rsi_3) and rsi_1>60
// Enter long trade
strategy.entry("Long", strategy.long, when=longCondition)

// Enter short trade
strategy.entry("Short", strategy.short, when=shortCondition)