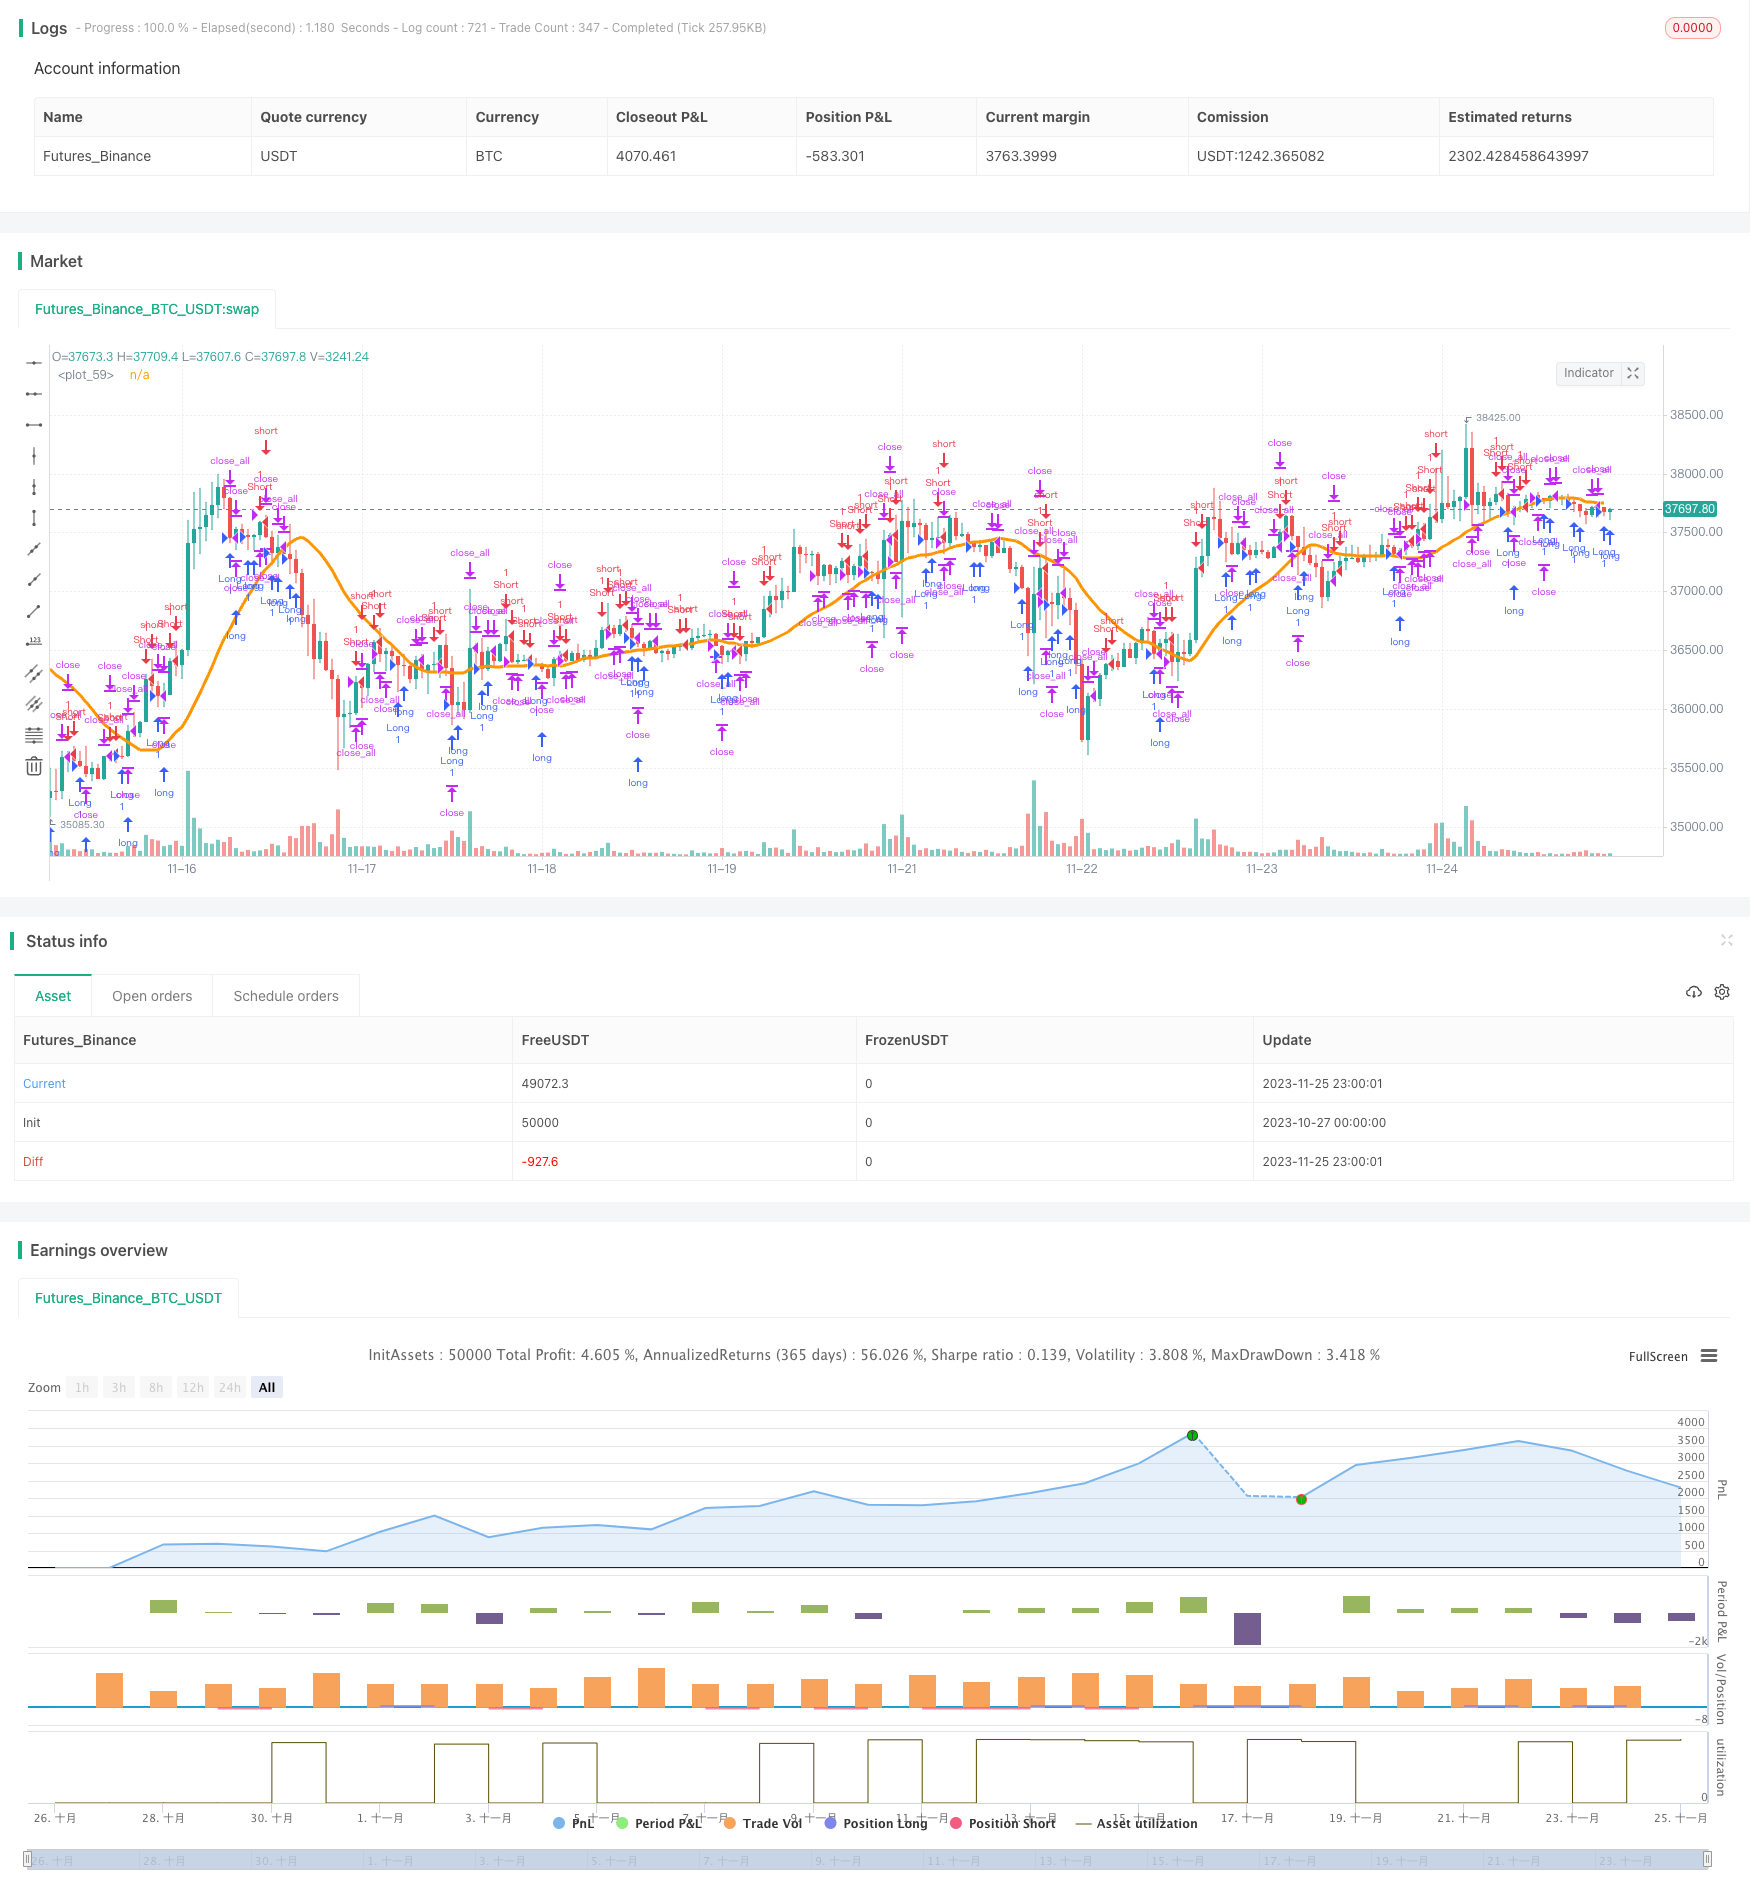
概述: 该策略是一种应用于加密货币的快速RSI跳空交易策略。它同时使用快速RSI指标和跳空的K线策略来寻找交易机会。
策略原理: 该策略同时使用两种主要指标:快速RSI和跳空的K线。
首先,它计算一个只有7根K线的快速RSI指标。该RSI指标更加灵敏,可以快速捕捉超买超卖现象。设置RSI上限为70,下限为30。当RSI大于70时为超买,小于30时为超卖。
其次,它检测跳空的K线。跳空指开盘价相对于前一日的收盘价有较大幅度的间隙。跳空是高波动的信号,预示着可能的趋势反转。
当检测到向下跳空的K线,而快速RSI指标显示超卖时,做多。当检测到向上跳空的K线,而快速RSI指标显示超买时,做空。
此外,该策略还设置了SMA均线和最小最大指标作为过滤器,避免误交易。只有在通过过滤器的情况下,才会出发真正的交易信号。
优势分析: 该策略最大的优势是捕捉快速的超买超卖现象以及跳空反转机会。特别适用于波动较大的加密货币市场,可以抓住快速的行情转折点。与常规RSI相比,快速RSI更加灵敏,可以适应加密货币的高频交易。最小最大指标和SMA均线的加持,也可以滤除一些误报机会,提高策略的稳定性。
风险分析: 该策略主要面临四方面的风险:
快速RSI指标设置得过于灵敏,导致产生大量误报信号的风险;
跳空可能是正常的价格波动而不是真正的反转,策略可能会遇到止损的风险;
在行情平淡的时候,容易躺平仓位较长时间;
策略参数如最小最大指标长度等设置不当,会导致信号稀释和效率低下。
对应地,以下方法可以降低上述风险:
调节快速RSI的参数,适当增加RSI周期数;
采用移动止损来锁定利润,避免跳空追踪出现亏损;
优化策略的参与度设置,在低波动行情控制策略参与度;
反复测试和优化参数,找到最佳参数以确保策略效果。
优化方向: 该策略的优化方向主要有:
探索其他价格指标如MACD、KDJ等与跳空结合,提高信号精确度;
添加自适应的止损设置根据市场波动自动调整止损点;
结合量能指标如OBV来检验跳空的确认信号,确认反转趋势;
对过滤器的长度和参数进行优化,找到最佳参数组合以减少误报;
研究不同加密货币对策略参数的适应性,设定更精准的参数。
通过这些优化,可以提升策略的稳定性、适应性和可靠性。
总结: 该快速RSI跳空策略是一种专门为加密货币波动行情而设计的高效交易策略。它结合了快速RSI指标的灵敏度和跳空K线的预测能力。通过不断的测试和优化可以进一步改善该策略抓住市场快速反转的能力,在波动性加密货币市场获得长期稳定收益。
/*backtest
start: 2023-10-27 00:00:00
end: 2023-11-26 00:00:00
period: 1h
basePeriod: 15m
exchanges: [{"eid":"Futures_Binance","currency":"BTC_USDT"}]
*/

//Noro
//2018

//@version=3
strategy(title = "Noro's Fast RSI Strategy v1.5", shorttitle = "Fast RSI str 1.5", overlay = true)

//Settings
needlong = input(true, defval = true, title = "Long")
needshort = input(true, defval = true, title = "Short")
usersi = input(true, defval = true, title = "Use Fast RSI Strategy")
usemm = input(true, defval = true, title = "Use Min/Max Strategy")
usesma = input(false, defval = false, title = "Use SMA Filter")
smaperiod = input(20, defval = 20, minval = 2, maxval = 1000, title = "SMA Filter Period")
fast = input(7, defval = 7, minval = 2, maxval = 50, title = "Fast RSI Period")
limit = input(30, defval = 30, minval = 1, maxval = 100, title = "RSI limit")
rsisrc = input(close, defval = close, title = "RSI Price")
rsibars = input(1, defval = 1, minval = 1, maxval = 20, title = "RSI Bars")
mmbars = input(1, defval = 1, minval = 1, maxval = 5, title = "Min/Max Bars")
showsma = input(false, defval = false, title = "Show SMA Filter")
showarr = input(false, defval = false, title = "Show Arrows")
fromyear = input(2018, defval = 2018, minval = 1900, maxval = 2100, title = "From Year")
toyear = input(2100, defval = 2100, minval = 1900, maxval = 2100, title = "To Year")
frommonth = input(01, defval = 01, minval = 01, maxval = 12, title = "From Month")
tomonth = input(12, defval = 12, minval = 01, maxval = 12, title = "To Month")
fromday = input(01, defval = 01, minval = 01, maxval = 31, title = "From day")
today = input(31, defval = 31, minval = 01, maxval = 31, title = "To day")

//Fast RSI
fastup = rma(max(change(rsisrc), 0), fast)
fastdown = rma(-min(change(rsisrc), 0), fast)
fastrsi = fastdown == 0 ? 100 : fastup == 0 ? 0 : 100 - (100 / (1 + fastup / fastdown))

//Limits
bar = close > open ? 1 : close < open ? -1 : 0
uplimit = 100 - limit
dnlimit = limit

//RSI Bars
upsignal = fastrsi > uplimit ? 1 : 0
dnsignal = fastrsi < dnlimit ? 1 : 0
uprsi = sma(upsignal, rsibars) == 1
dnrsi = sma(dnsignal, rsibars) == 1

//Body
body = abs(close - open)
abody = sma(body, 10)

//MinMax Bars
min = min(close, open)
max = max(close, open)
minsignal = min < min[1] and bar == -1 and bar[1] == -1 ? 1 : 0
maxsignal = max > max[1] and bar == 1 and bar[1] == 1 ? 1 : 0
mins = sma(minsignal, mmbars) == 1
maxs = sma(maxsignal, mmbars) == 1

//SMA Filter
sma = sma(close, smaperiod)
colorsma = showsma ? blue : na
plot(sma, color = colorsma, linewidth = 3)

//Signals
up1 = bar == -1 and (strategy.position_size == 0 or close < strategy.position_avg_price) and dnrsi and body > abody / 5 and usersi
dn1 = bar == 1 and (strategy.position_size == 0 or close > strategy.position_avg_price) and uprsi and body > abody / 5 and usersi
up2 = mins and (close > sma or usesma == false) and fastrsi < 70 and usemm
dn2 = maxs and (close < sma or usesma == false) and fastrsi > 30 and usemm
exit = ((strategy.position_size > 0 and fastrsi > dnlimit and bar == 1) or (strategy.position_size < 0 and fastrsi < uplimit and bar == -1)) and body > abody / 2

//Arrows
col = exit ? black : up1 or dn1 ? blue : up2 or dn2 ? red : na
needup = up1 or up2
needdn = dn1 or dn2
needexitup = exit and strategy.position_size < 0
needexitdn = exit and strategy.position_size > 0
plotarrow(showarr and needup ? 1 : na, colorup = blue, colordown = blue, transp = 0)
plotarrow(showarr and needdn ? -1 : na, colorup = blue, colordown = blue, transp = 0)
plotarrow(showarr and needexitup ? 1 : na, colorup = black, colordown = black, transp = 0)
plotarrow(showarr and needexitdn ? -1 : na, colorup = black, colordown = black, transp = 0)

//Trading
if up1 or up2
    strategy.entry("Long", strategy.long, needlong == false ? 0 : na, when=(time > timestamp(fromyear, frommonth, fromday, 00, 00) and time < timestamp(toyear, tomonth, today, 23, 59)))

if dn1 or dn2
    strategy.entry("Short", strategy.short, needshort == false ? 0 : na, when=(time > timestamp(fromyear, frommonth, fromday, 00, 00) and time < timestamp(toyear, tomonth, today, 23, 59)))

if time > timestamp(toyear, tomonth, today, 23, 59) or exit
    strategy.close_all()