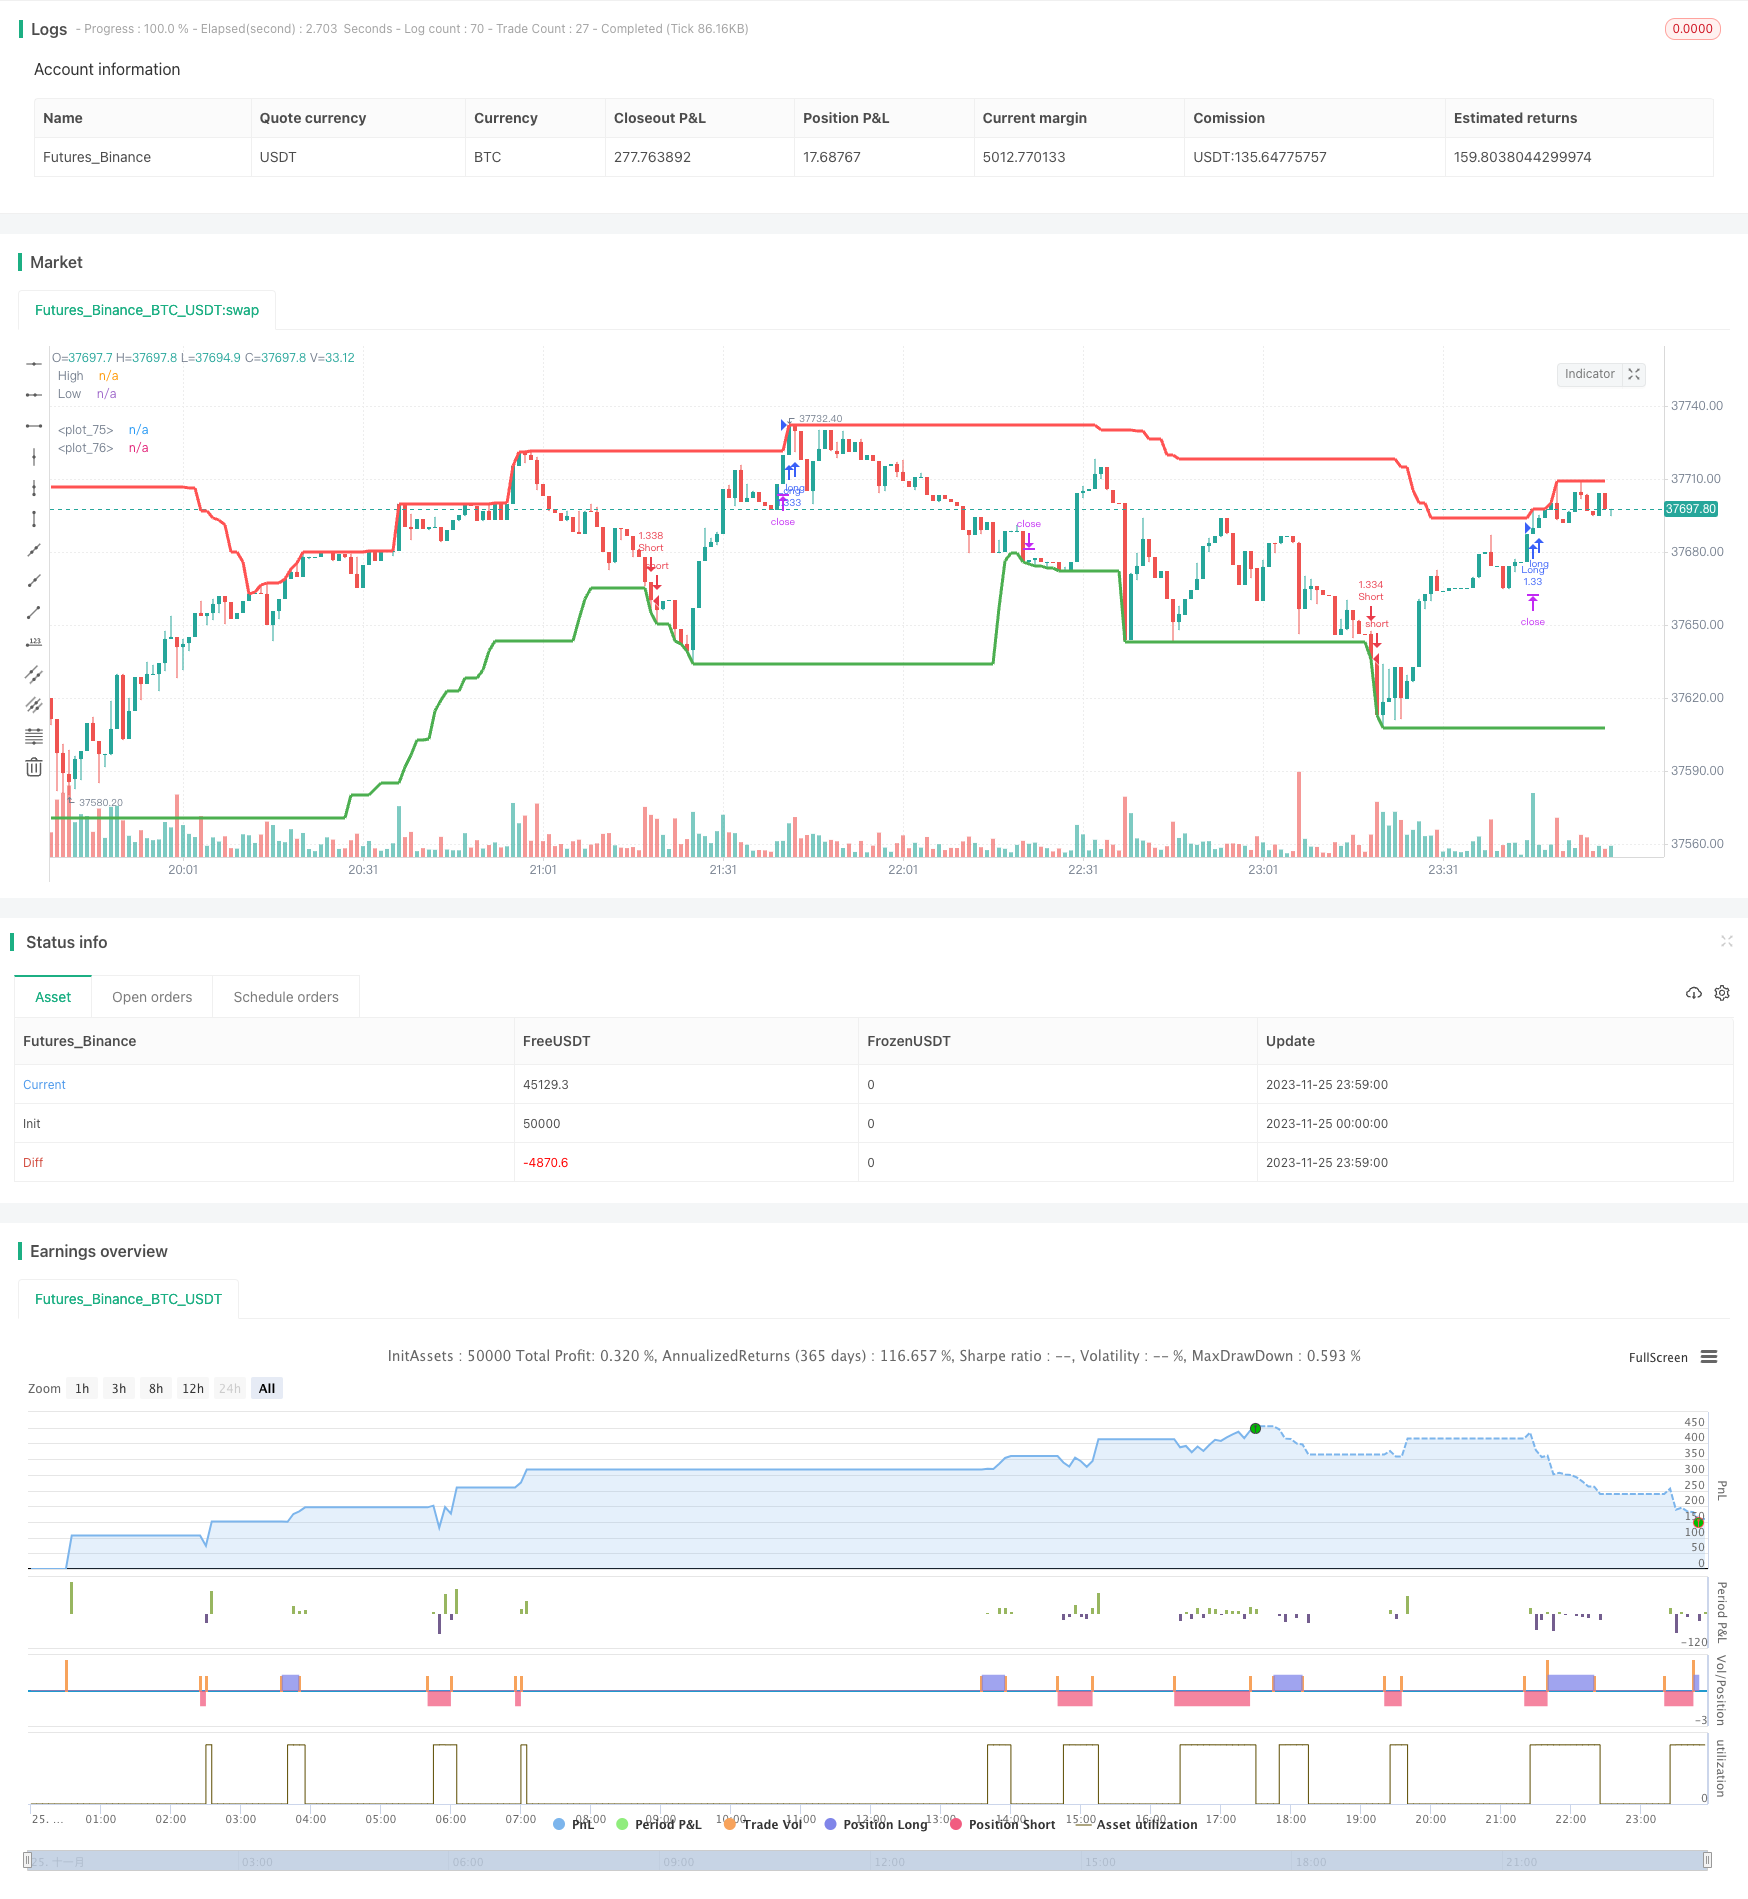
概述
高低突破回测策略是一种利用股票历史高点和低点,判断价格是否突破这些高低点的趋势跟踪策略。它通过计算一定周期内的最高价和最低价,当当前周期的价格超过最近一定周期的最高价时,产生买入信号;当价格跌破最近一定周期的最低价时,产生卖出信号。这种策略属于趋势跟踪策略的一种,可以抓住股票价格的趋势性特征,具有一定的实战价值。
策略原理
该策略的核心逻辑是计算一定周期内(默认50根K线)的最高价和最低价。计算最高价和最低价时,可以选择使用收盘价或最高价和最低价(默认使用最高价和最低价)。然后判断当前K线的收盘价或最高价是否超过最近一定周期内的最高价,如果是并且距离上一个最高价已经有一定周期(默认30根K线),就产生买入信号。同理,判断当前K线的收盘价或最低价是否低于最近一定周期内的最低价,如果是并且距离上一个最低价已经有一定周期,就产生卖出信号。
当产生买入信号后,策略会在该价格买入,并设置止损价和止盈价。当价格触碰止损价时,策略会止损退出;当价格触碰止盈价时,策略会止盈退出。卖出信号的逻辑也是类似的。
优势分析
这种高低突破回测策略具有以下几个优势:
- 策略逻辑简单,容易理解和实现。
- 能够抓住股票价格的趋势性特征,随着价格趋势运行。
- 可以通过调整参数Finding最合适的策略参数组合。
- 内置止损和止盈机制,可以控制风险。
- 可视化的展示极大方便参数调整和结果分析。
风险分析
该策略也存在一些风险:
- 容易产生多次反复交易和过度交易。
- 当价格震荡时,会频繁打开头寸。
- 指标参数不当时,可能错过大的趋势性机会。
- 没有考虑到股价的波动频率和幅度。
- 没有结合其他指标来验证信号。
为了控制这些风险,可以从以下几个方面进行优化:
- 适当缩小止损幅度,增加持仓时间。
- 增加开仓条件,避免频繁开仓。
- 优化参数,找到最佳参数组合。
- 结合其他指标过滤信号。
优化方向
该高低突破回测策略可以从以下几个方面进行优化:
参数优化。可以通过更系统地测试不同的参数组合,找到最优参数。
结合其他指标过滤信号。例如可以结合移动平均线指标,只有当价格突破最高价时,并且短期移动平均线上穿长期移动平均线时,才产生买入信号。
考虑股价的波动频率。例如可以结合ATR指标,当股价波动加大时,适当放宽突破的幅度。
区分趋势市和震荡市。在趋势明显的阶段,适当放宽参数,以便跟踪趋势;在震荡市场时,适当收紧参数。
增加仓位管理机制。例如当亏损达到一定比例时停止开仓等。
总结
总的来说,高低突破回测策略是一个简单实用的趋势跟踪策略。它通过判断价格是否突破一定周期内的最高价和最低价来决定交易信号。该策略具有简单、趋势跟踪、可参数优化等优势,同时也存在产生过度交易、无法处理震荡市等风险。我们可以从参数优化、指标过滤、仓位管理等多个方面对该策略进行优化,使其效果能够进一步提升。
/*backtest
start: 2023-11-25 00:00:00
end: 2023-11-26 00:00:00
period: 1m
basePeriod: 1m
exchanges: [{"eid":"Futures_Binance","currency":"BTC_USDT"}]
*/

//@version=3
strategy("High/Low Breaker Backtest 1.0", overlay=true, initial_capital=1000, default_qty_type=strategy.percent_of_equity, default_qty_value=100, max_bars_back=700)

// Strategy Settings
takeProfitPercentageLong = input(.1, title='Take Profit Percentage Long', type=float)/100
stopLossPercentageLong = input(0.15, title='Stop Loss Percentage Long', type=float)/100
takeProfitPercentageShort = input(.1, title='Take Profit Percentage Short', type=float)/100
stopLossPercentageShort = input(0.15, title='Stop Loss Percentage Short', type=float)/100


candlesBack = input(title="Number of candles back",  defval=50)
useHighAndLows =  input(true, title="Use high and lows (uncheck to use close)", defval=true)
lastBarsBackMinimum =  input(title="Number of candles back to ignore for last high/low",  defval=30)
showHighsAndLows = input(true, title="Show high/low lines", defval=true)

getIndexOfLowestInSeries(series, period) =>
    index = 0
    current = series
    for i = 1 to period
        if series[i] <= current
            index := i
            current := series[i]
    index

getIndexOfHighestInSeries(series, period) =>
    index = 0
    current = series
    for i = 1 to period
        if series[i] >= current
            index := i
            current := series[i]
    index

indexOfHighestInRange = getIndexOfHighestInSeries(useHighAndLows ? high : close, candlesBack)
indexOfLowestInRange = getIndexOfLowestInSeries(useHighAndLows ? low : close, candlesBack)

max = useHighAndLows ? high[indexOfHighestInRange] : close[indexOfHighestInRange]
min = useHighAndLows ? low[indexOfLowestInRange] : close[indexOfLowestInRange]

barsSinceLastHigh = indexOfHighestInRange
barsSinceLastLow = indexOfLowestInRange

isNewHigh = (useHighAndLows ? high > max[1] : close > max[1]) and (barsSinceLastHigh[1] + 1 > lastBarsBackMinimum)
isNewLow = (useHighAndLows ? low < min[1] : close < min[1]) and (barsSinceLastLow[1] + 1 > lastBarsBackMinimum)

alertcondition(condition=isNewHigh, title="New High", message="Last High Broken")
alertcondition(condition=isNewLow, title="New Low", message="Last Low Broken")

if high > max
    max := high
    barsSinceLastHigh := 0

if low < min
    min := low
    barsSinceLastLow := 0

plot( showHighsAndLows ? max : na, color=red, style=line, title="High", linewidth=3)
plot( showHighsAndLows ? min : na, color=green, style=line, title="Low", linewidth=3)

// Strategy Entry/Exit Logic
goLong =isNewHigh
longStopLevel = strategy.position_avg_price * (1 - stopLossPercentageLong)
longTakeProfitLevel = strategy.position_avg_price * (1 + takeProfitPercentageLong)

goShort = isNewLow
shortStopLevel = strategy.position_avg_price * (1 + stopLossPercentageShort)
shortTakeProfitLevel = strategy.position_avg_price * (1 - takeProfitPercentageShort)

strategy.entry("Long", strategy.long, when=goLong)
strategy.exit("Long Exit", "Long", stop=longStopLevel, limit=longTakeProfitLevel)

strategy.entry("Short", strategy.short, when=goShort)
strategy.exit("Short Exit", "Short", stop=shortStopLevel, limit=shortTakeProfitLevel)

plot(goShort ? shortStopLevel : na, color=yellow, style=linebr, linewidth=2)
plot(goShort ? shortTakeProfitLevel : na, color=blue, style=linebr, linewidth=2)
plot(goLong ? longStopLevel : na, color=yellow, style=linebr, linewidth=2)
plot(goLong ? longTakeProfitLevel : na, color=blue, style=linebr, linewidth=2)