Four Indicator Momentum Reversal Strategy

Overview
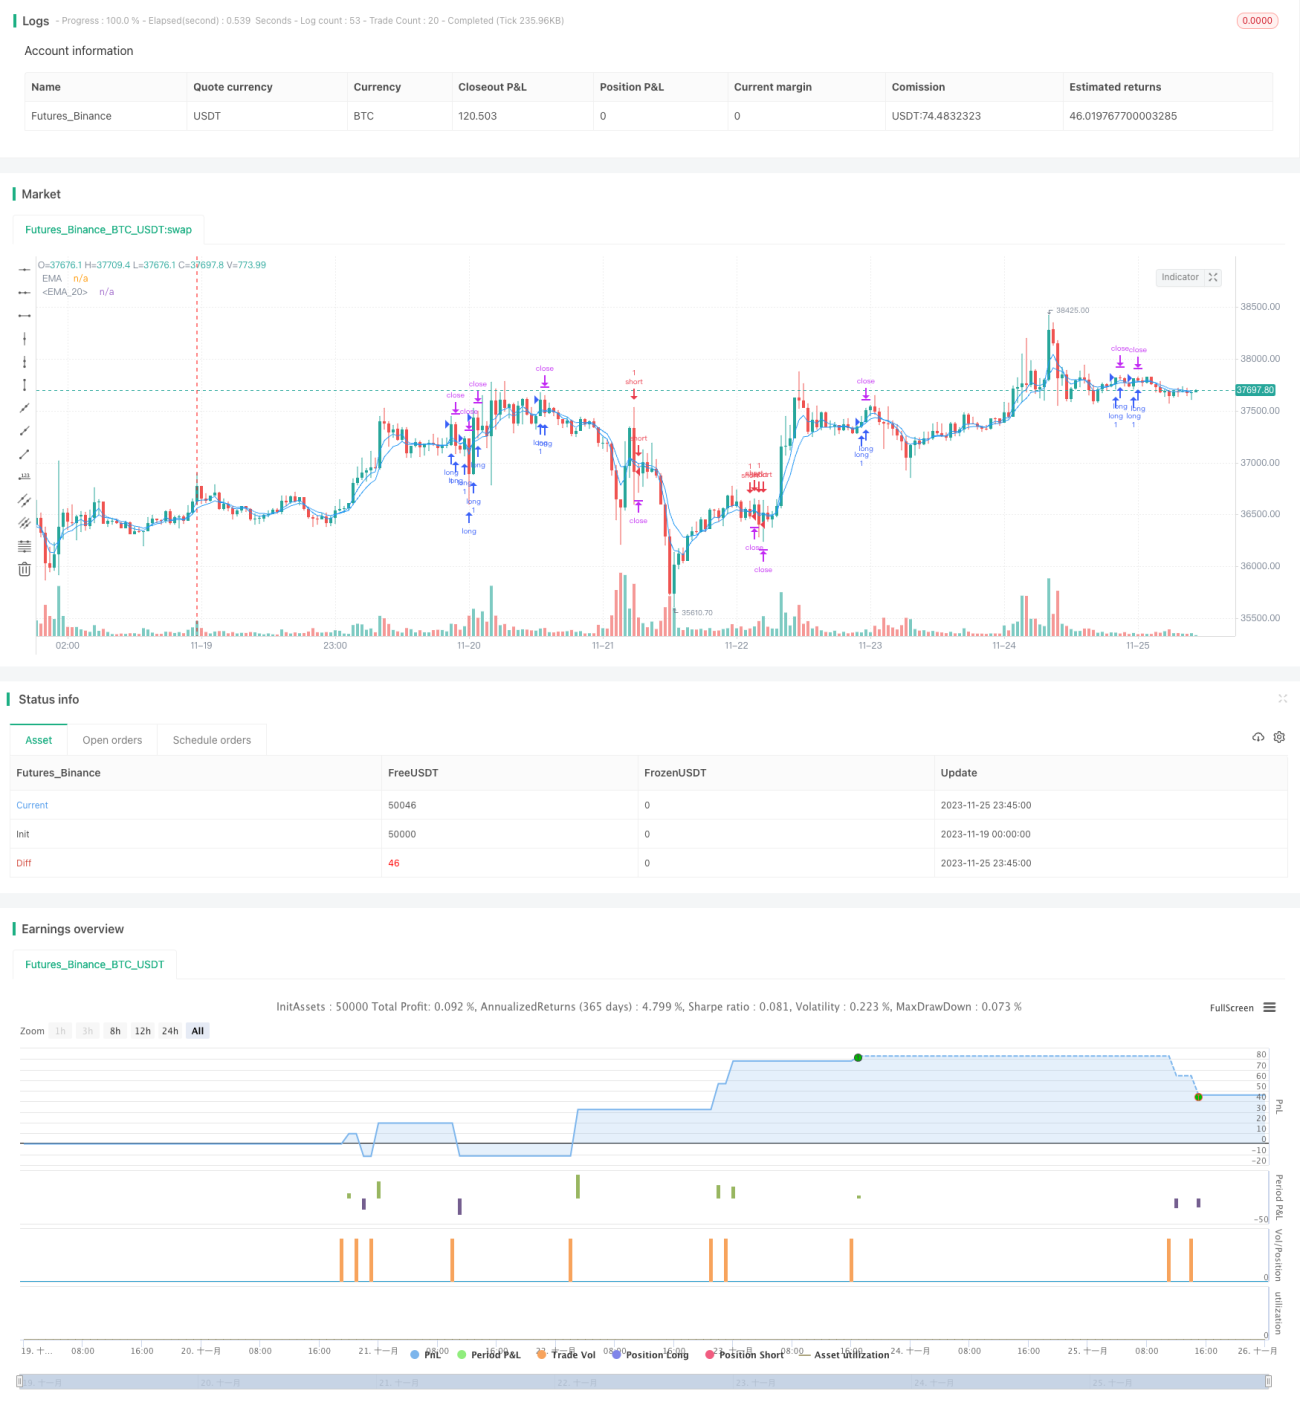
This strategy utilizes three mainstream technical indicators: the moving average EMA, the relative strength index RSI and the commodity channel index CCI to identify price momentum through EMA crossovers and further entries confirmed by oversold/overbought readings from RSI and CCI. This intermediate-term trading strategy aims to capture momentum reversals.
Strategy Logic
-
Use crossovers between 4-period and 8-period EMA to determine price momentum – the faster 4-period EMA to swiftly react and the slower 8-period EMA to confirm;
-
When EMAs turn upward, i.e. the 4-period EMA crossing above the 8-period EMA, check that RSI (over 65) and CCI (above 0) are not overbought to give a long signal;
-
When EMAs turn downward, i.e. the 4-period EMA crossing below the 8-period EMA, check that RSI (below 35) and CCI (below 0) are oversold to give a short signal;
-
Set stop loss and take profit prices based on input distances once trade signals are triggered.
In summary, this strategy considers medium-term trend and short-term overbought/oversold levels to form relatively stable signals, while stop losses and take profits effectively limit loss per trade.
Advantage Analysis
-
Multiple indicators mitigate false signals from individual oscillators;
-
EMAs determine the main trend while RSI and CCI avoid overheated areas to improve win rate;
-
Automatic stop loss and take profit setup constrains loss in extreme moves;
-
Purely technical nature makes this strategy easily implementable across any timeframe.
Risk Analysis
-
Major fundamental news can override technical levels;
-
Stop loss may be taken out by huge volatility calls for wider stops;
-
Frequent trading drives higher transaction costs thus best left for high frequency algorithms.
Enhancement Opportunities
-
Incorporate machine learning models to auto-adjust parameters based on fundamentals;
-
Build adaptive stops reacting to volatility rather than fixed distances.
Conclusion
This multifaceted strategy can deliver consistent medium-term profits under optimized parameters, making it an accessible technical system. Still, allowance needs to be given to black swan events via expanded stops etc, presenting areas for ongoing refinements.
- 1