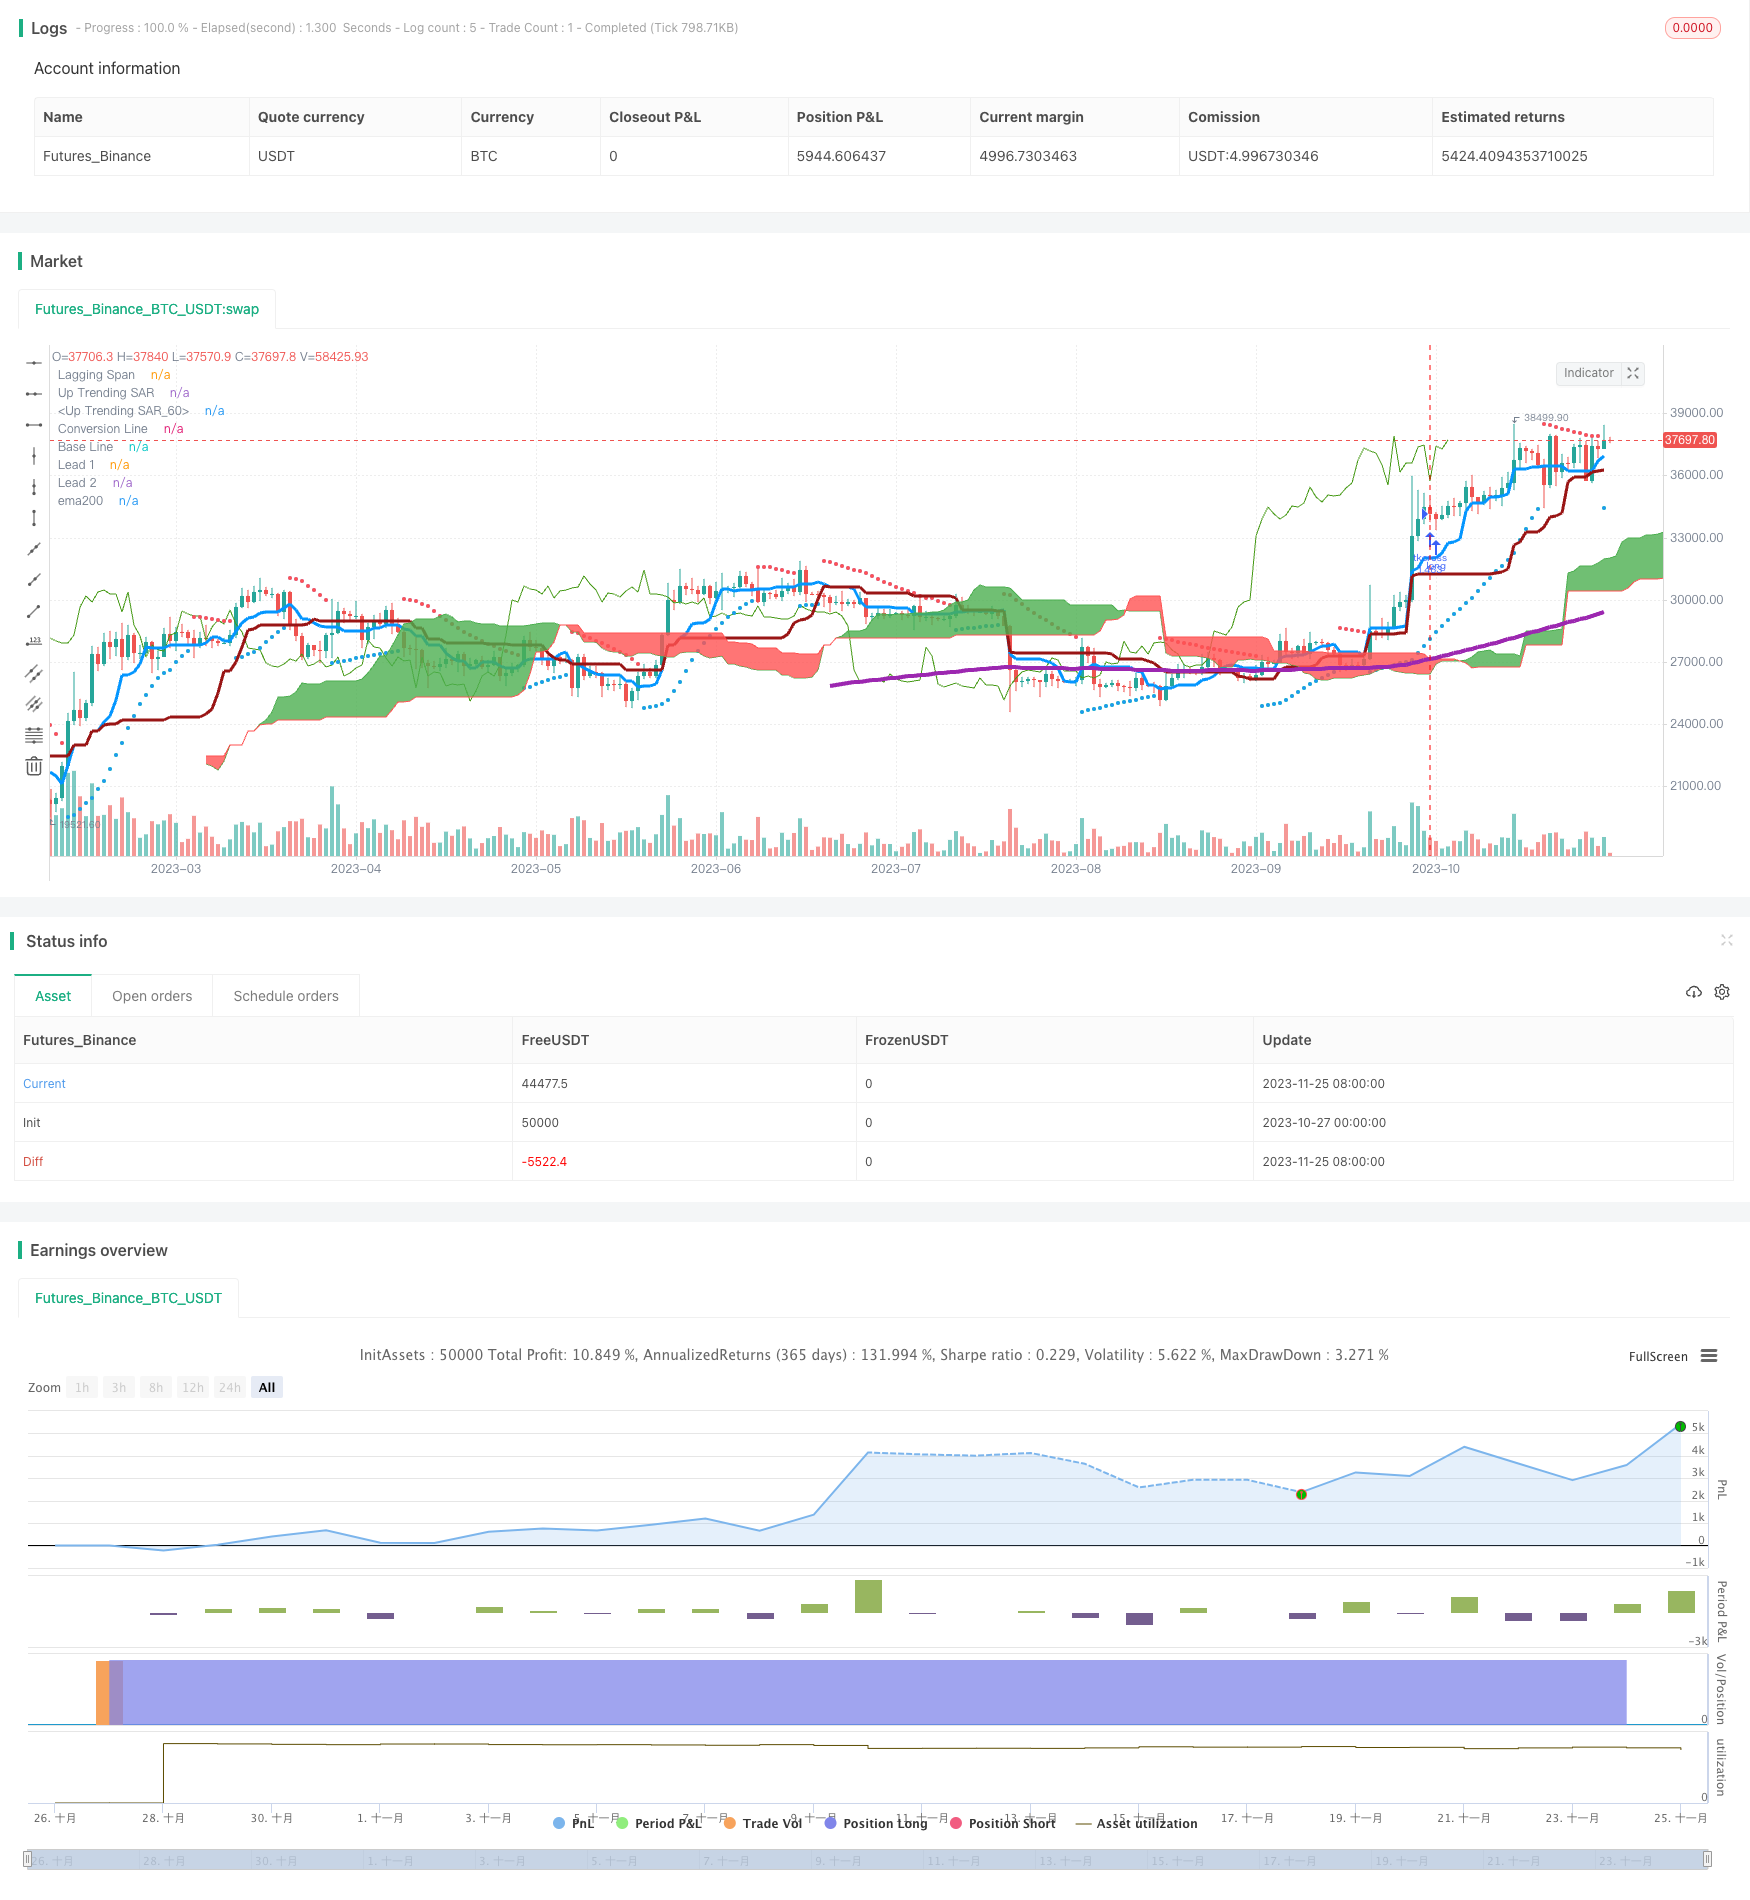
概述
该策略是一个基于均线的趋势追踪型策略。它利用Ichimoku云图指标判断趋势方向,结合200日移动平均线过滤信号,实现趋势跟踪。
策略原理
该策略主要使用了一云图的转换线和基线来判断趋势方向。转换线是过去9天的中价平均值,基线是过去26天的中价平均值。当转换线上穿基线时为买入信号,下穿为卖出信号。
该策略还使用200日移动平均线来过滤信号。只有当收盘价高于200日线时,才会产生买入信号入市。这可以过滤掉大部分假信号。
在退出方面,策略简单的使用转换线下穿基线作为平仓信号。
优势分析
该策略结合趋势判断指标一云图和长期趋势过滤指标200日线,可以有效跟踪趋势,过滤掉大部分假信号。采用中价平均等参数可以减少由于价格异常波动对均线的影响。
相比单一使用移动平均线等指标,该策略可以更好地捕捉趋势转折点,从而及时调整仓位。这是其最大的优势。
风险分析
该策略主要依赖一云图指标判断趋势方向,而一云图本身也会产生错信号。如果判断产生偏差,该策略将可能导致损失。
此外,参数设置不当也会导致策略表现不佳。如果转换线参数过短,就容易形成假信号;如果基线参数过长,则跟踪效果会变差。需要调参优化以取得平衡。
优化方向
可以考虑结合其他指标来提高信号质量,例如KDJ指标判定超买超卖区域来过滤信号。或者使用ATR指标来设定止损位。
参数方面可以测试更多组合,如调整转换线参数为5或7天等,来获得更灵敏的交易信号。同时也可以测试修改基线参数为20天左右,以平衡跟踪效果。
此外,也可以考虑在特定波动环境下关闭策略,避开剧烈行情的影响。
总结
该策略整合趋势判断和长期过滤指标的优点,可以有效跟踪中长期趋势。同时参数设置和风控措施也需要持续优化,以减少错信号和波动带来的影响。整体来说该策略表现可以,有一定的实际操作价值。
策略源码
/*backtest
start: 2023-10-27 00:00:00
end: 2023-11-26 00:00:00
period: 1d
basePeriod: 1h
exchanges: [{"eid":"Futures_Binance","currency":"BTC_USDT"}]
*/

//@version=3
strategy(title="TK Cross > EMA200 Strat",  overlay=true)

ema200 = ema(close, 200)
conversionPeriods = input(9, minval=1, title="Conversion Line Periods"),
basePeriods = input(26, minval=1, title="Base Line Periods")
laggingSpan2Periods = input(52, minval=1, title="Lagging Span 2 Periods"),
displacement = input(26, minval=1, title="Displacement")

donchian(len) => avg(lowest(len), highest(len))

conversionLine = donchian(conversionPeriods)
baseLine = donchian(basePeriods)
leadLine1 = avg(conversionLine, baseLine)
leadLine2 = donchian(laggingSpan2Periods)

plot(conversionLine, color=#0496ff, title="Conversion Line", linewidth=3)
plot(baseLine, color=#991515, title="Base Line", linewidth=3)
plot(close, offset = -displacement, color=#459915, title="Lagging Span")

p1 = plot(leadLine1, offset = displacement, color=green,
 title="Lead 1")
p2 = plot(leadLine2, offset = displacement, color=red,
 title="Lead 2")
fill(p1, p2, color = leadLine1 > leadLine2 ? green : red)

plot(ema200, color=purple, linewidth=4,title='ema200')
strategy.initial_capital = 50000

strategy.entry('tkcross', strategy.long, strategy.initial_capital / close, when=conversionLine>baseLine and close > ema200)
strategy.close('tkcross', when=conversionLine<baseLine)


start = input(2, minval=0, maxval=10, title="Start - Default = 2 - Multiplied by .01")
increment = input(2, minval=0, maxval=10, title="Step Setting (Sensitivity) - Default = 2 - Multiplied by .01" )
maximum = input(2, minval=1, maxval=10, title="Maximum Step (Sensitivity) - Default = 2 - Multiplied by .10")
sus = input(true, "Show Up Trending Parabolic Sar")
sds = input(true, "Show Down Trending Parabolic Sar")
disc = input(false, title="Start and Step settings are *.01 so 2 = .02 etc, Maximum Step is *.10 so 2 = .2")
//"------Step Setting Definition------"
//"A higher step moves SAR closer to the price action, which makes a reversal more likely."
//"The indicator will reverse too often if the step is set too high."

//"------Maximum Step Definition-----")
//"The sensitivity of the indicator can also be adjusted using the Maximum Step."
//"While the Maximum Step can influence sensitivity, the Step carries more weight"
//"because it sets the incremental rate-of-increase as the trend develops"

startCalc = start * .01
incrementCalc = increment * .01
maximumCalc = maximum * .10

sarUp = sar(startCalc, incrementCalc, maximumCalc)
sarDown = sar(startCalc, incrementCalc, maximumCalc)

colUp = close >= sarDown ? lime : na
colDown = close <= sarUp ? red : na

plot(sus and sarUp ? sarUp : na, title="Up Trending SAR", style=circles, linewidth=3,color=colUp)
plot(sds and sarDown ? sarDown : na, title="Up Trending SAR", style=circles, linewidth=3,color=colDown)