Momentum Breakout Moving Average Strategy

Overview
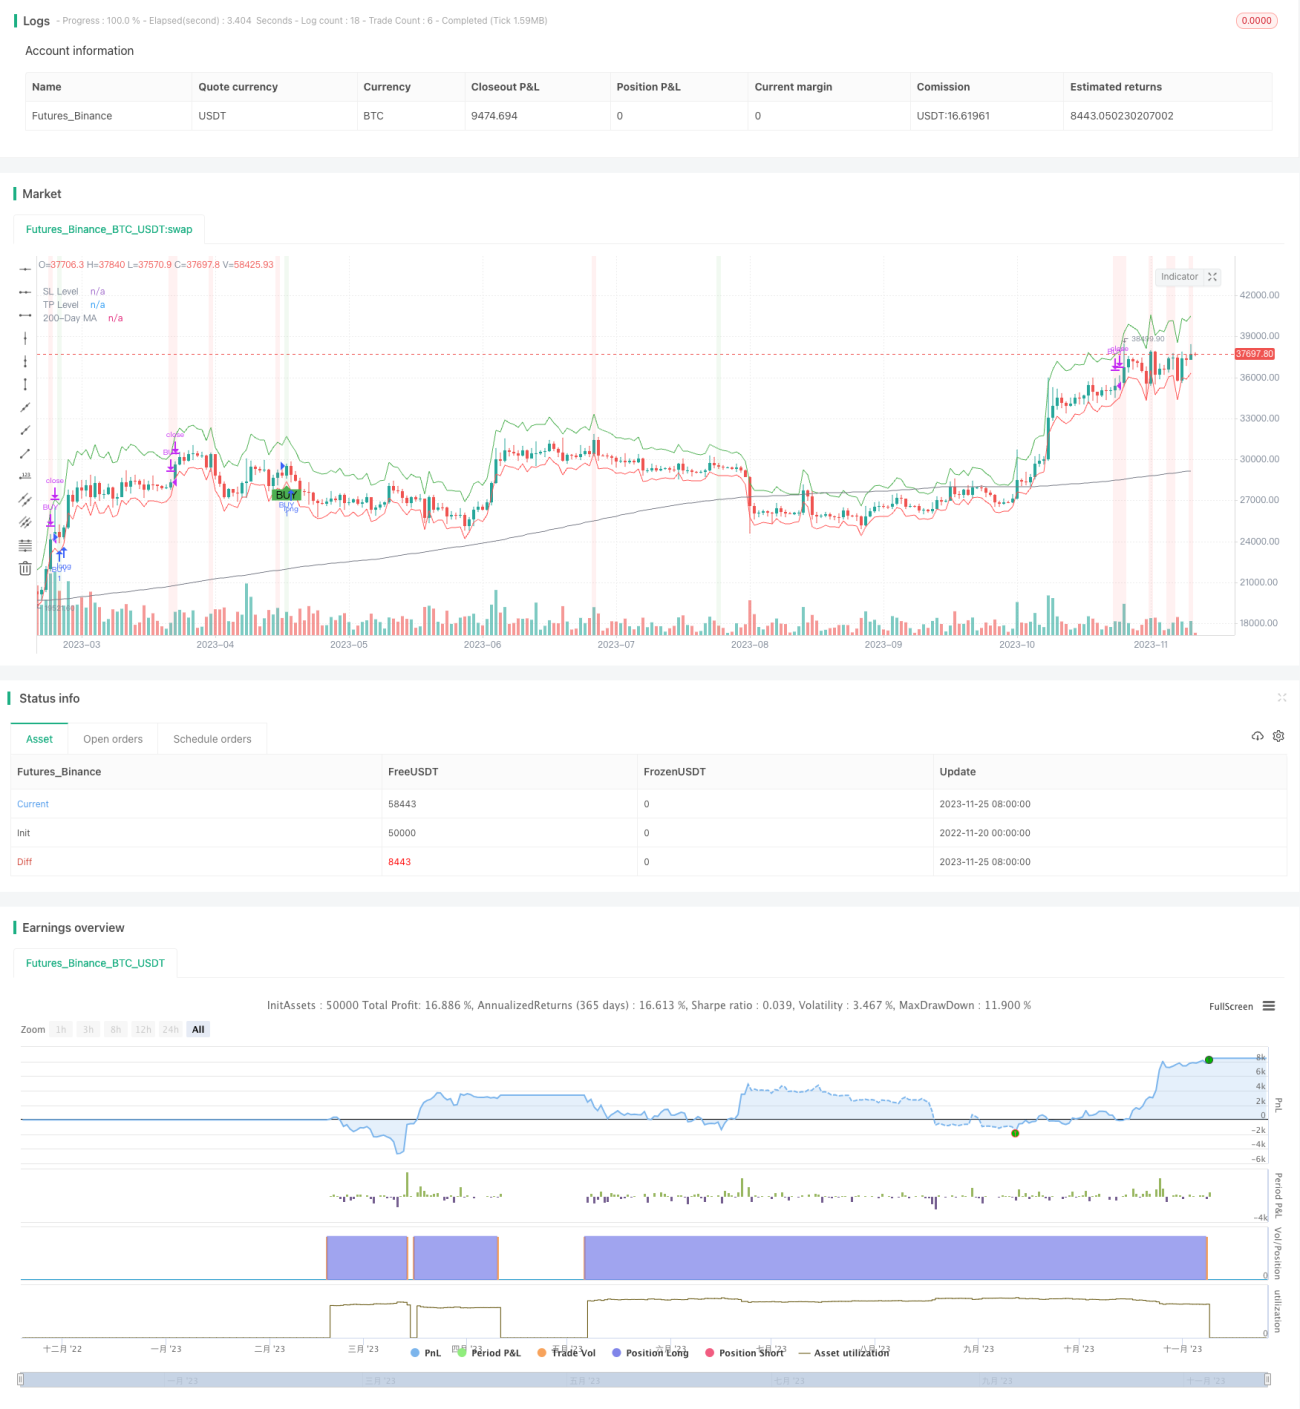
The Momentum Breakout Moving Average strategy is a stock trading strategy that combines moving average crossover signals with momentum indicators. The strategy employs multiple technical indicators including Exponential Moving Average (EMA), Simple Moving Average (SMA), Moving Average Convergence Divergence (MACD), and a modified Relative Strength Index (StockRSI) to generate buy signals when confirming an upward long-term trend. When short-term momentum indicators show reversal signals, the strategy takes profit.
Strategy Logic
The key components of this strategy are:
-
EMA/SMA Crossover: A 9-period EMA fast line crosses above a 21-period SMA slow line to trigger a buy signal.
-
MACD Indicator: MACD histogram needs to be positive when combined with the EMA/SMA crossover signal as additional confirmation.
-
StockRSI Indicator: Signals are triggered when StockRSI is above the OVERBOUGHT level (80) or below the OVERSOLD level (20).
-
Bollinger Bands: Require the price to be within the bands where the middle band is a 20-period SMA and the width of bands is two standard deviations.
-
Stop Loss and Take Profit: Calculated based on 14-period ATR.
The strategy requires at least 2 out of the 3 indicators to give buy signals, price is within the Bollinger Bands, and the long-term trend remains bullish to generate the final buy signal. It gives a sell signal when MACD histogram turns negative and StockRSI enters the overbought region.
Advantage Analysis
The key strengths of this strategy are:
-
Excellent Backtest Results: Multiple proven indicators lead to outperformance over benchmark and individual indicators.
-
Optimized Parameters: Key parameters like EMA periods and Bollinger Bands are optimized for improved stability.
-
Automated Stop Loss/Profit Taking: Bollinger Bands and ATR allow dynamic adjustment of stops for better risk control.
-
Easy to Implement: Clean code structure and easy data accessibility result in straightforward practical operations.
Risk Analysis
Despite the decent performance, main risks include:
-
False Signals: Unusual market fluctuations or failure of indicators may generate incorrect signals. Long-term trend should then be incorporated as an additional filter.
-
Inadequate Parameters: Improper parameters could lead to overly frequent trading or insufficient sensitivity. Parameters should be adjusted according to different products and market environments.
-
Inappropriate Stop Loss: A stop loss that is too tight tends to get stopped out prematurely, while a stop loss set too wide may result in excessive losses. Proper balance between stop loss and take profit levels should be achieved.
To address the above risks, the following measures can be adopted:
-
Manual Intervention: In abnormal situations, signals can be manually checked, parameters readjusted or strategies temporarily halted.
-
Parameter Optimization: More scientific and objective methods like genetic algorithms can be employed for systematic optimization.
-
Volatility Adjusted Stops: Stop loss ranges can be set at 1-3 times of ATR to incorporate volatility.
Enhancement Opportunities
The strategy can be further improved in the following areas:
-
More Robust Stop Loss Mechanisms: Trailing stop loss or stops based on moving averages can be incorporated.
-
Volume Filters: Adding volume indicators to avoid false breakouts.
-
Dynamic Parameters: Automatically optimizing parameters like moving average periods and band width based on changing market conditions.
-
Machine Learning: LSTM, RNN and other algorithms can enable dynamic optimization of parameters.
Conclusion
The Momentum Breakout Moving Average Strategy capitalizes on the strengths of combining multiple technical indicators, and has achieved decent profitability with long and short term confirmation. With good risk control procedures in implementation, this strategy has ample potential for further improvements on areas like stop loss mechanisms and signal filtering to achieve more consistent alpha returns.
- 1