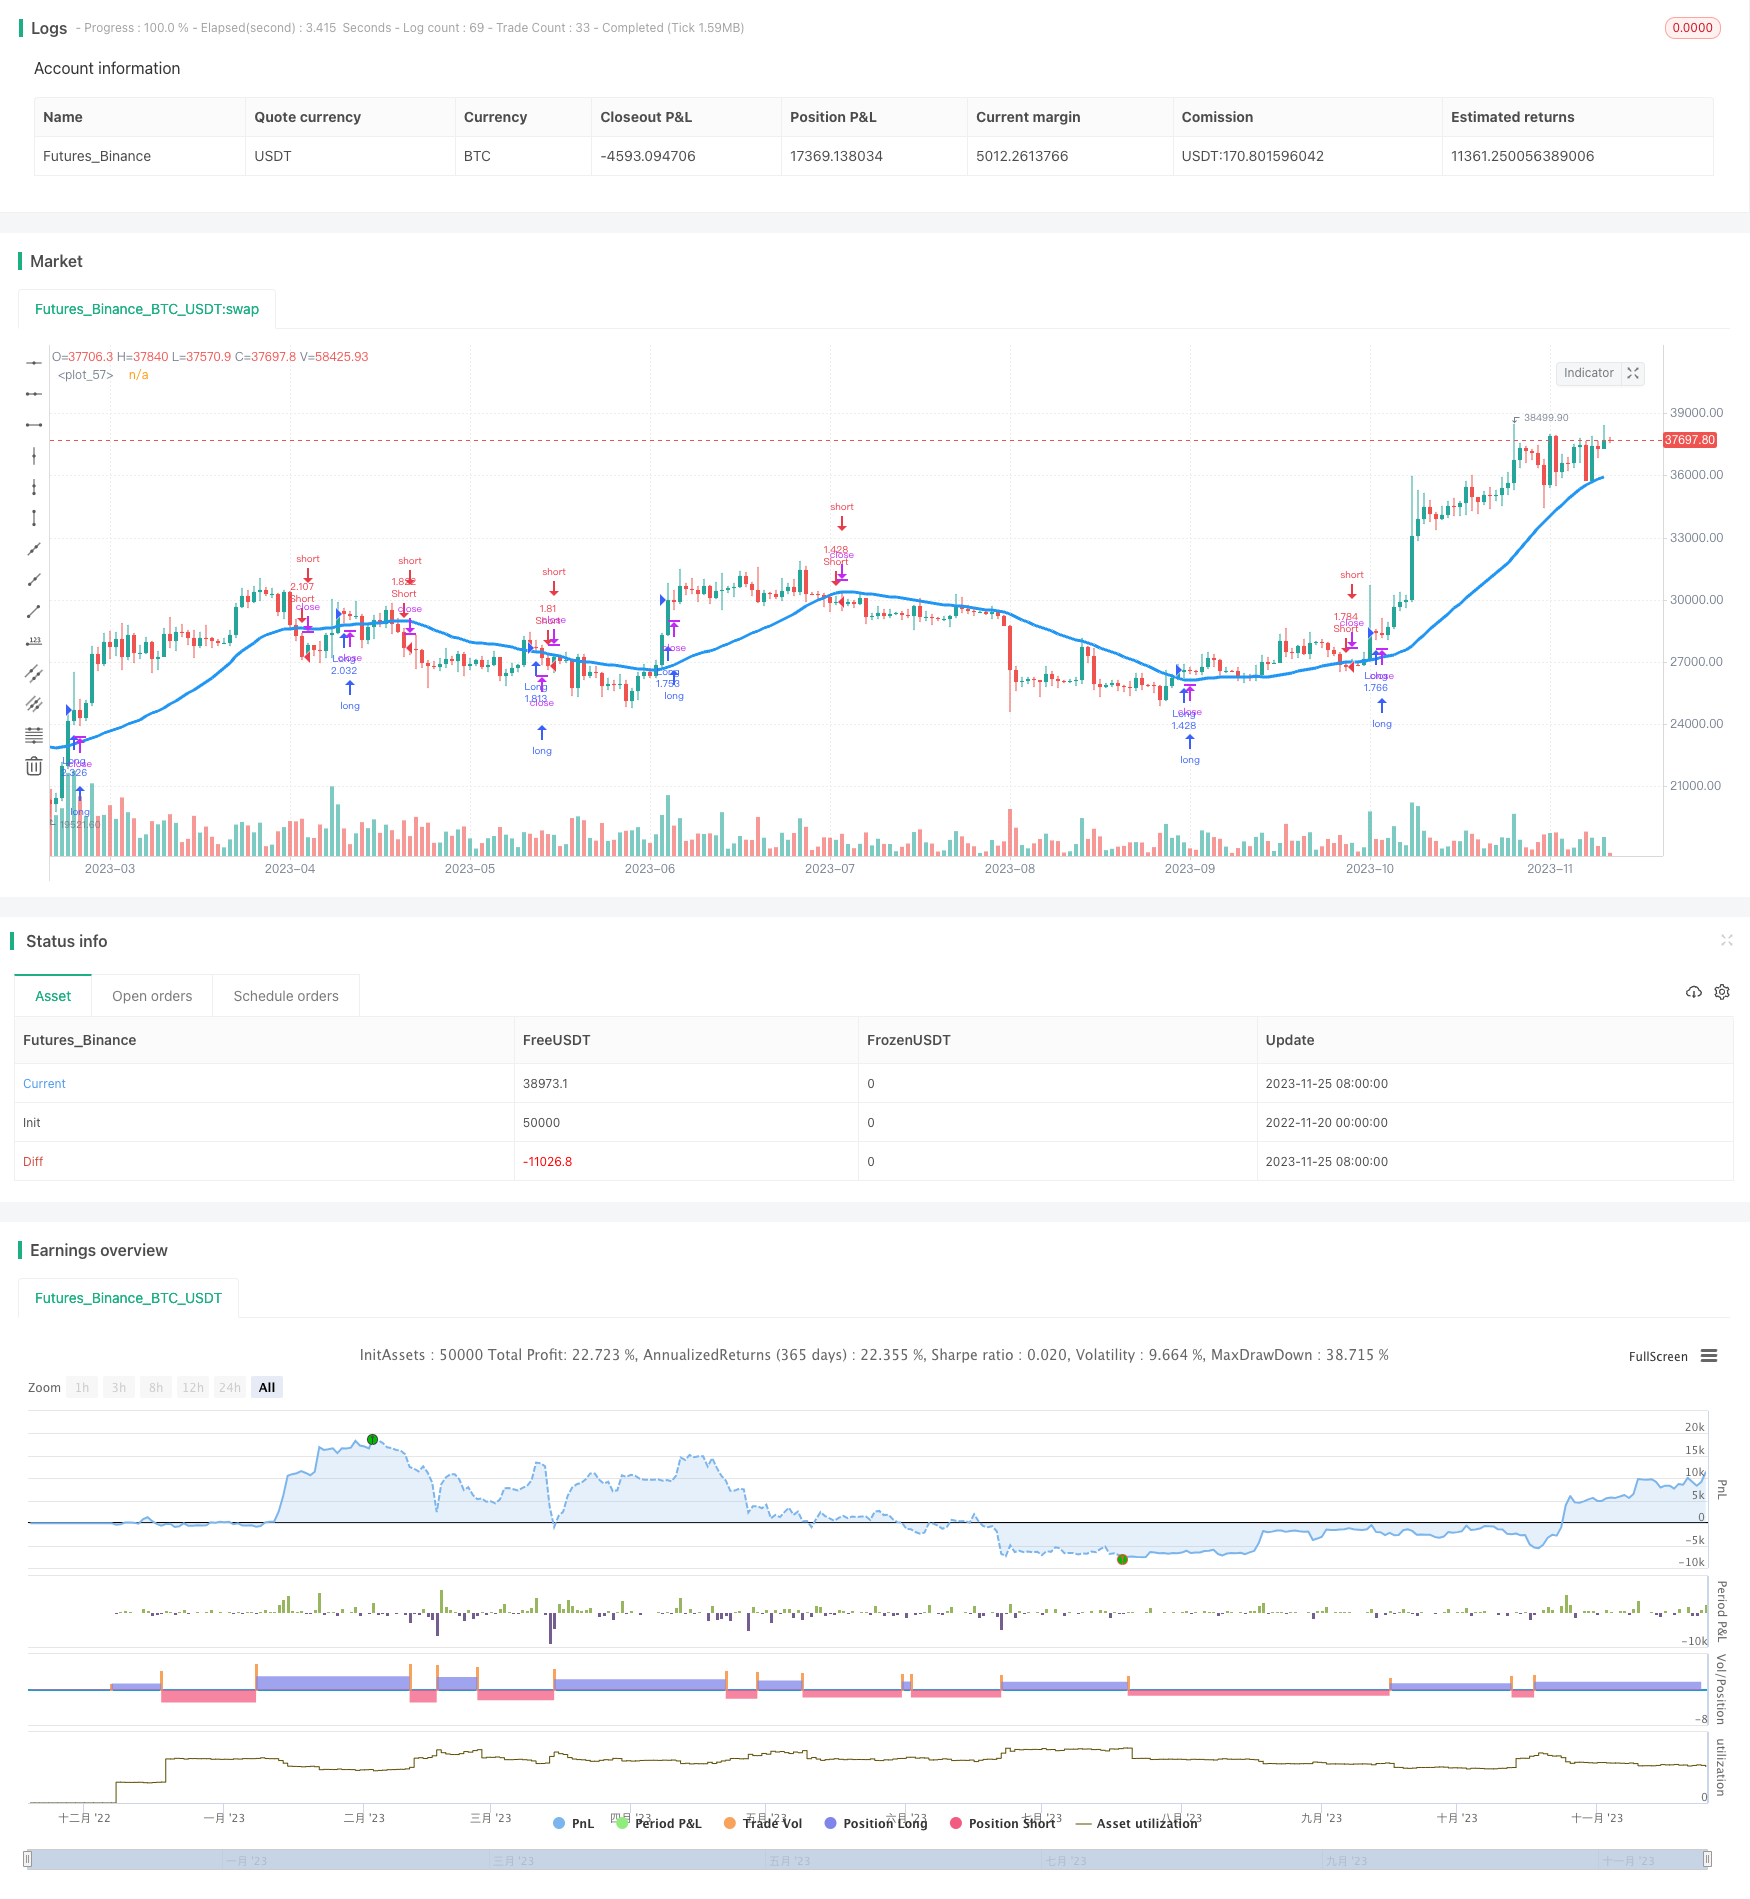
概述
该策略本质上是一种均线交叉策略。通过计算价格的移动平均线,并设定一定的长短期移动平均线,当短期移动平均线从下方上穿越长期移动平均线时做多;当短期移动平均线从上方下穿长期移动平均线时做空。
策略原理
价格平均线交叉策略的核心思想是:价格的移动平均线能够有效反映价格变化的趋势。策略通过设置两条不同周期的移动平均线,以及一定的交易逻辑,来判断行情趋势的变化从而产生交易信号。
该策略计算出一条较长期的均线以及一条较短期的均线。长线主要判断大趋势,短线用于捕捉大趋势过程中的中短期波动。策略的交易信号主要来源于短线对长线的交叉:短线上穿长线为做多信号,短线下穿长线为做空信号。此外,策略还对信号进行了进一步的过滤处理,以避免出现假信号。
具体来说,该策略采用7种不同类型的移动平均线,包括SMA、EMA、VWMA等,用户可以选择移动平均线的类型。移动平均线的长度也可以灵活设置。此外,策略还提供了一定的交易时间段限制和仓位管理机制。通过这些设定,用户可以灵活调整策略的参数以适应不同品种和市场环境。
优势分析
价格平均线交叉策略的主要优势有以下几个方面:
策略逻辑清晰简单,易于理解和实现,适合初学者学习。
策略原理稳健,基于充分验证的均线交易法则,历经市场实践检验。
策略参数灵活可调,用户可以根据自己对市场的判断和偏好选择合适的参数。
策略具备一定的风险控制机制,能减少亏损单的持有时间并防止不必要的反向开仓。
策略包含多种平均线类型,用户可以选择最适合自己交易品种的移动平均线类型。
策略支持在特定交易时间段开启交易逻辑,避免主要假日市场的异常波动。
风险分析
虽然价格平均线交叉策略有诸多优势,但在实际交易中也存在一定的风险,主要体现在以下两个方面:
由于大部分移动平均线存在滞后性,交叉信号有可能出现在价格反转完成后的晚期,容易被套住。
参数设置不当的情况下,交叉信号可能过于频繁,使交易活跃度过高而产生较多交易成本。
针对上述风险,可以通过以下方式加以控制和应对:
通过设置适度的止损幅度,控制单笔亏损风险。
增加过滤条件,降低交易频率,防止过度交易。例如设置价格通道或价格波动幅度条件等。
优化移动平均线的参数,选择最适合自身交易品种和周期的参数组合。测试不同市场条件下策略的稳定性。
优化方向
该价格平均线交叉策略还有进一步优化的空间,主要可以从以下几个方面入手:
增加过激行情下的保护机制。例如在价格剧烈波动时暂停交易,避开市场异常期。
增加更多过滤条件和组合交易信号,提高信号的质量和稳定性。例如结合其它技术指标识别趋势性较强的交叉。
采用动态的参数体系。根据市场条件和品种特性自动调整移动平均线长度、交易开关等关键参数,而不是使用固定的数值。
在复合多品种套利等高级策略中应用该平均线交叉信号。与其它信息组合,进行深度策略优化。
以上这些建议都可以使该策略的适用环境更广,交易效果更佳,更好地综合风险回报。
总结
本文对Noro’s CrossMA简单均线交叉策略进行了详细的代码解析和解读。我们分析了它的策略思想、原理结构、主要优势以及可能的改进方向。该策略整体来说逻辑清晰,简单实用,参数调整灵活,可适应于多种交易环境。我们还剖析了策略中存在的问题和风险,给出了针对性的处理建议。相信通过这些综合分析和讨论,可以使交易者更深入理解该类型策略,并有助于其不断优化实盘交易系统。
/*backtest
start: 2022-11-20 00:00:00
end: 2023-11-26 00:00:00
period: 1d
basePeriod: 1h
exchanges: [{"eid":"Futures_Binance","currency":"BTC_USDT"}]
*/

//Noro
//2019

//@version=4
strategy(title = "Noro's CrossMA", shorttitle = "CrossMA", overlay = true, default_qty_type = strategy.percent_of_equity, default_qty_value = 100.0, pyramiding = 0, commission_value = 0.1)

needlong = input(true, "long")
needshort = input(true, "short")
lotsize = input(100, defval = 100, minval = 1, maxval = 10000, title = "Lot, %")
type = input(defval = "SMA", options = ["SMA", "EMA", "VWMA", "DEMA", "TEMA", "KAMA", "PCMA"], title = "MA type")
src = input(close, defval = close, title = "MA Source")
len = input(30, defval = 30, minval = 1, title = "MA length")
off = input(00, defval = 00, minval = 0, title = "MA offset")
anti = input(true, defval = true, title = "Anti-saw filter")
showma = input(true, defval = true, title = "Show MA")
showbg = input(false, defval = false, title = "Show background")
fromyear = input(1900, defval = 1900, minval = 1900, maxval = 2100, title = "From Year")
toyear = input(2100, defval = 2100, minval = 1900, maxval = 2100, title = "To Year")
frommonth = input(01, defval = 01, minval = 01, maxval = 12, title = "From Month")
tomonth = input(12, defval = 12, minval = 01, maxval = 12, title = "To Month")
fromday = input(01, defval = 01, minval = 01, maxval = 31, title = "From day")
today = input(31, defval = 31, minval = 01, maxval = 31, title = "To day")

//DEMA
dema = 2 * ema(src, len) - ema(ema(close, len), len)

//TEMA
xPrice = close
xEMA1 = ema(src, len)
xEMA2 = ema(xEMA1, len)
xEMA3 = ema(xEMA2, len)
tema = 3 * xEMA1 - 3 * xEMA2 + xEMA3

//KAMA
xvnoise = abs(src - src[1])
nfastend = 0.20
nslowend = 0.05
nsignal = abs(src - src[len])
nnoise = sum(xvnoise, len)
nefratio = iff(nnoise != 0, nsignal / nnoise, 0)
nsmooth = pow(nefratio * (nfastend - nslowend) + nslowend, 2)
kama = 0.0
kama := nz(kama[1]) + nsmooth * (src - nz(kama[1]))

//PriceChannel
lasthigh = highest(src, len)
lastlow = lowest(src, len)
center = (lasthigh + lastlow) / 2

sma_1 = sma(src, len)
ema_1 = ema(src, len)
vwma_1 = vwma(src, len)
ma2 = type == "SMA" ? sma_1 : type == "EMA" ? ema_1 : type == "VWMA" ? vwma_1 : type == "DEMA" ? dema : type == "TEMA" ? tema : type == "KAMA" ? kama : type == "PCMA" ? center : 0
ma = ma2[off]

macol = showma ? color.blue : na
plot(ma, color = macol, linewidth = 3, transp = 0)

//Background
trend = 0
trend := anti == false and close > ma ? 1 : anti == false and close < ma ? -1 : low > ma ? 1 : high < ma ? -1 : trend[1]
bgcol = showbg ? trend == 1 ? color.lime : trend == -1 ? color.red : na : na
bgcolor(bgcol, transp = 70)

//Trading
size = strategy.position_size
truetime = time > timestamp(fromyear, frommonth, fromday, 00, 00) and time < timestamp(toyear, tomonth, today, 23, 59)
lot = 0.0
lot := size != size[1] ? strategy.equity / close * lotsize / 100 : lot[1]
if trend == 1 and trend[1] == -1
    strategy.entry("Long", strategy.long, lot, when = needlong and truetime)
if trend == -1 and trend[1] == 1
    strategy.entry("Short", strategy.short, lot, when = needshort and truetime)
if size > 0 and needshort == false and trend == -1
    strategy.close_all()
if size < 0 and needlong == false and trend == 1
    strategy.close_all()
if time > timestamp(toyear, tomonth, today, 23, 59)
    strategy.close_all()
    strategy.cancel("Long")
    strategy.cancel("Short")