Dynamic RSI and CCI Combined Multi-factor Quantitative Trading Strategy

Overview
This strategy combines dynamic RSI, CCI and multiple MA moving averages to implement a multi-factor driven quantitative trading strategy. The strategy takes into account multiple dimensions such as trend, overbought and oversold to make judgments and generate trading signals.
Strategy Principle
Technical Indicators
- MA: Calculates average closing price over a period to determine price trend
- RSI: Judges overbought and oversold levels
- CCI: Judges overbought and oversold status
- Stoch KDJ: Judges deviation of stochastic from main trend
Trading Signals
Buy signal: MA12 crosses over MA26, CCI below 100 (oversold), Stoch KDJ below 80 (oversold)
Sell signal: RSI crosses below dynamic threshold, Stoch KDJ above 80 (overbought)
Advantages
- Multi-factor driven, comprehensive judgment, lower false signals
- Dynamic threshold for sellable, real-time overbought and oversold detection
- Combines trend, stochastic, mainstream technical indicators
- Adopts multiple parameter tuning, high flexibility
Risks
- Overly complex multi-factor combination, difficult parameter tuning
- Performance highly related to parameter selection
- Requires strict quantitative process for parameter optimization
- High curve fitting risk
Optimization
- More dataset testing for strategy robustness
- Multiple parameter combination testing to find optimum
- Add stop loss to reduce maximum drawdown
- Add position sizing to avoid chasing and killing
- Test adaptability across different products
Conclusion
This strategy combines multiple technical indicators and multi-factor driven judgments with parameter tuning and statistical validation to achieve good results. But higher complexity, need to prevent overfitting, and control position sizing and stop loss to reduce maximum drawdown. Can further expand strategy across products and timeframes.
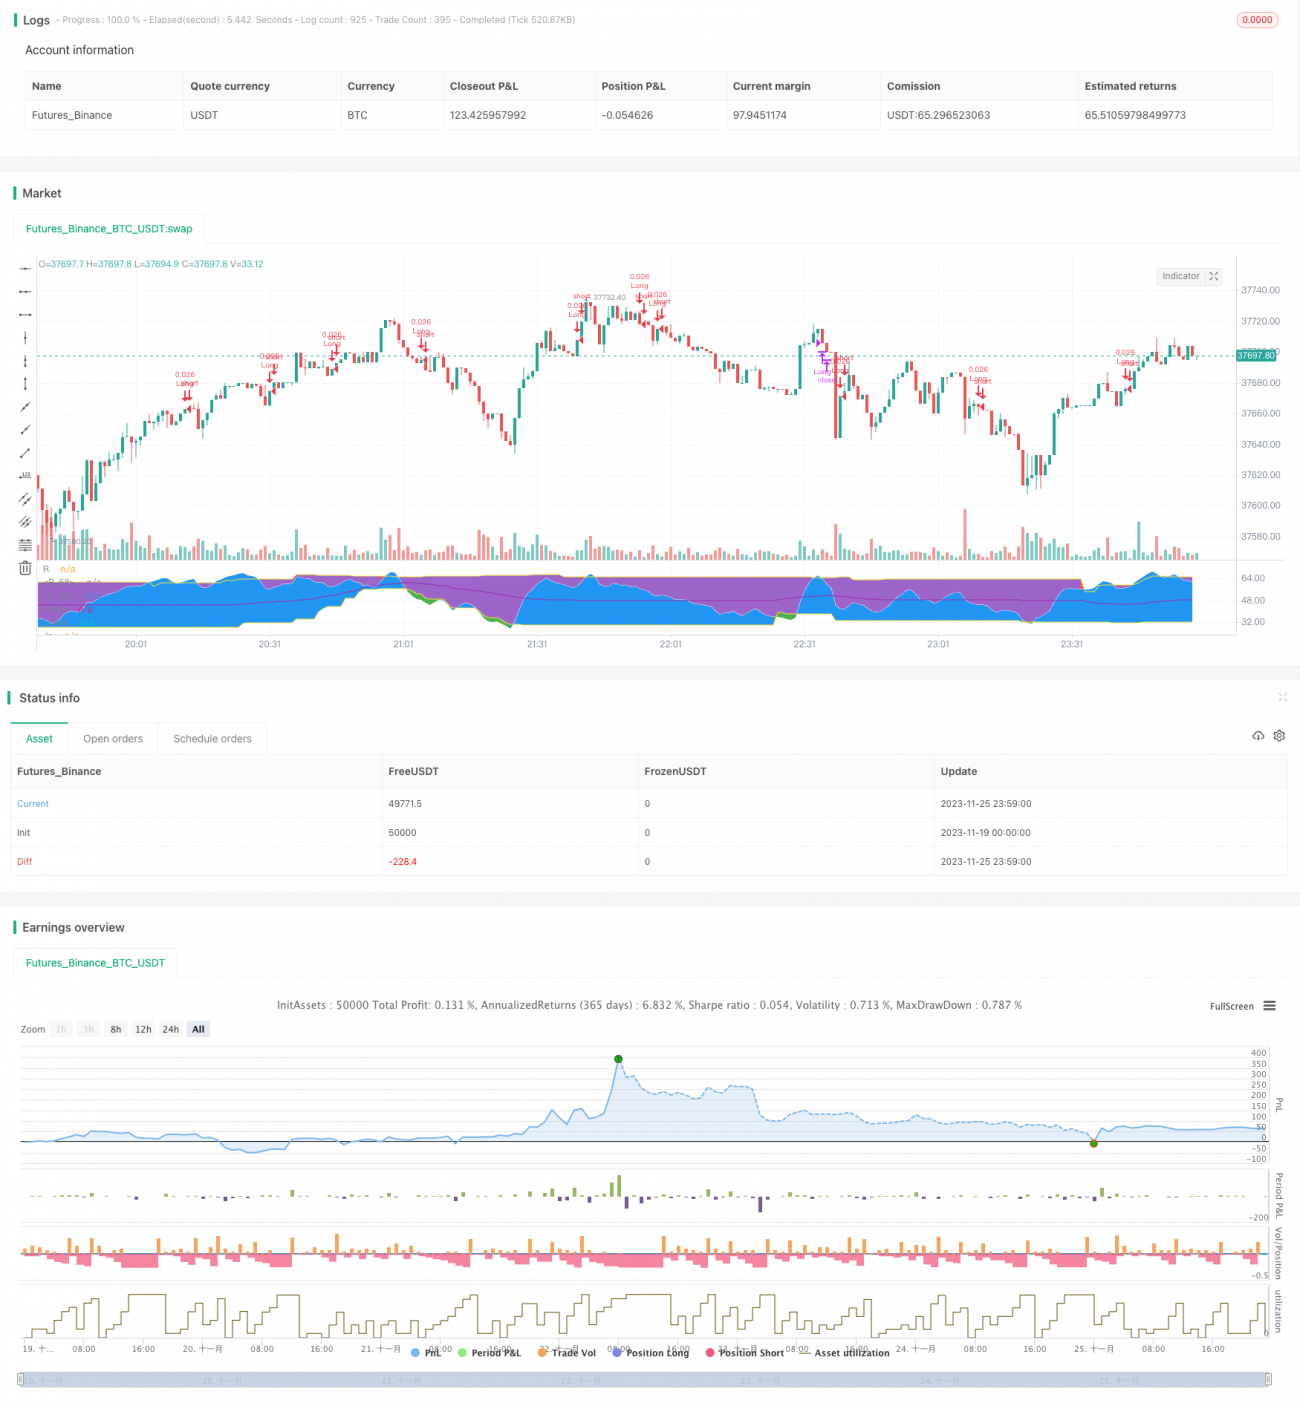
/*backtest
start: 2023-11-19 00:00:00
end: 2023-11-26 00:00:00
period: 1m
basePeriod: 1m
exchanges: [{"eid":"Futures_Binance","currency":"BTC_USDT"}]
*/

//@version=4
strategy(title="ATOM2.0", shorttitle="ATOM V2.0", overlay=false, default_qty_type=strategy.cash, currency=currency.USD, initial_capital=200, default_qty_type=strategy.cash, default_qty_value=100, pyramiding=10)

// Set Parameter MA12- 1