概述
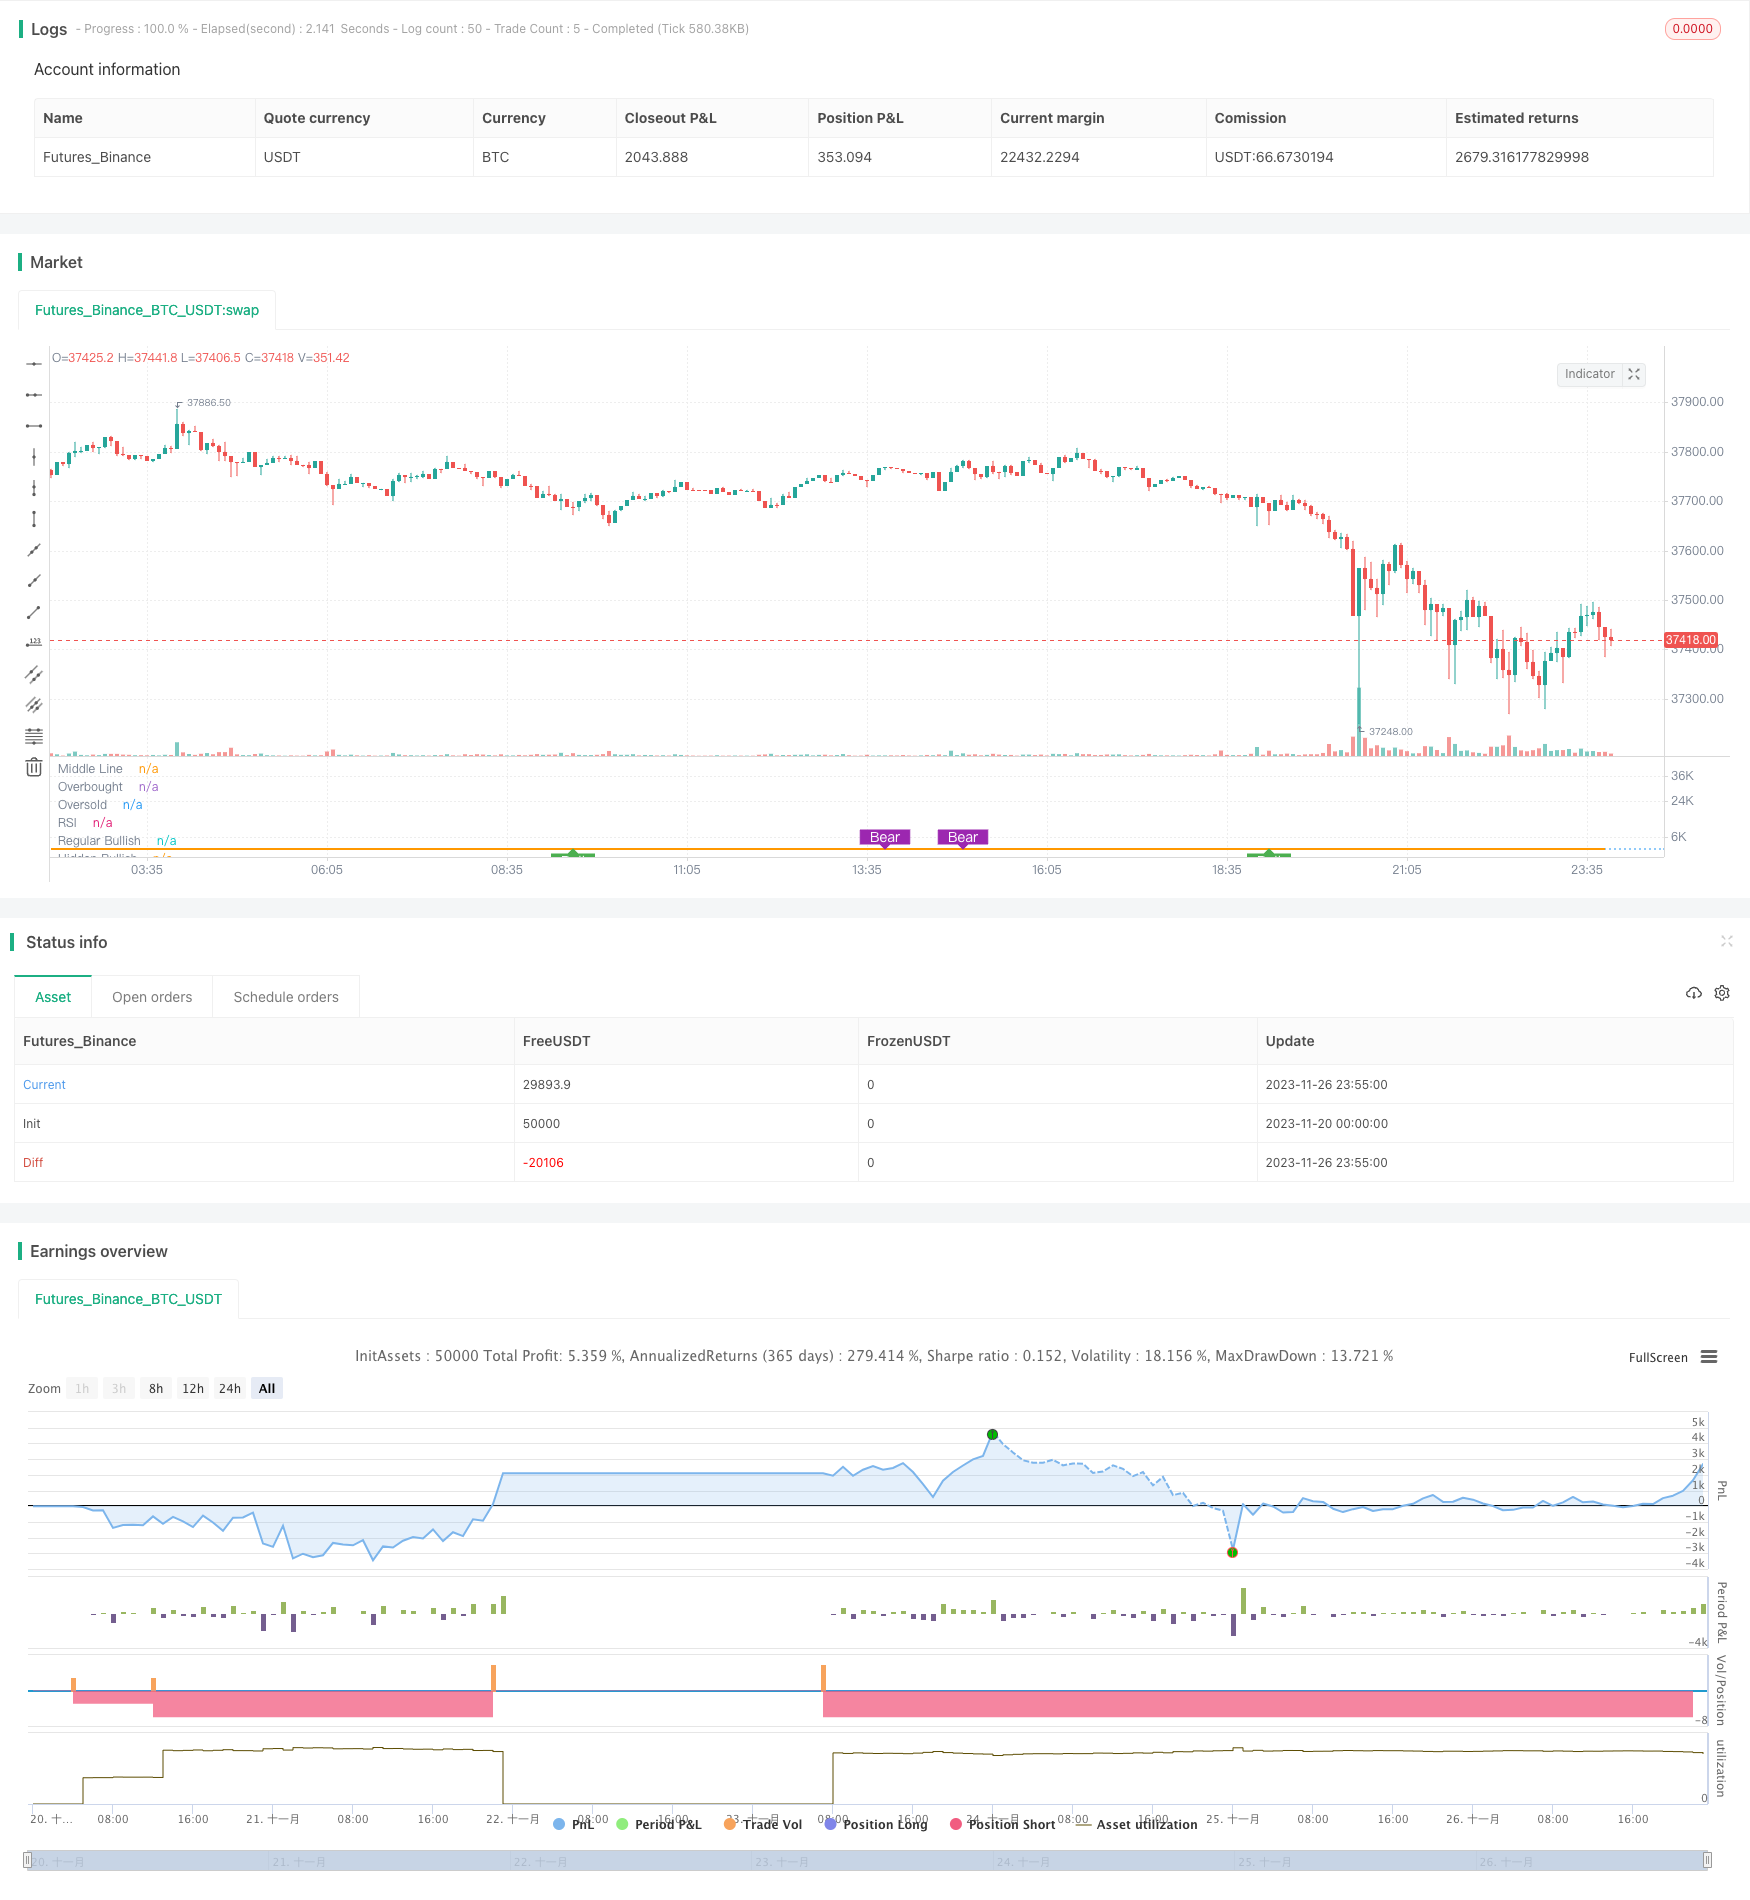
该策略名为“基于转折点的RSI背离策略”(Pivot-based RSI Divergence Strategy)。它利用RSI指标在不同周期上的背离来判断买入卖出点,并在此基础上增加了长线RSI作为过滤条件,从而提高策略的稳定性。
策略原理
该策略主要判断短线RSI(如5日RSI)与价格出现“隐藏型多头背离”或“常规型多头背离”时机会买入;出现“隐藏型空头背离”或“常规型空头背离”时机会卖出。
所谓“常规型多头背离”是指:价格创新低而RSI未创新低;“隐藏型多头背离”则相反,价格未创新低而RSI创新低。两者定义中的“新低”和“新高”是相对于一定滚动窗口的历史极值而言的。
此外,策略还引入长线RSI(如50日RSI)作为过滤条件。只有当长RSI大于50时,才考虑买入信号;当长RSI小于30时,考虑止损或止盈退出。
策略优势
该策略最大的优势在于同时利用短线RSI的背离信号和长线RSI的过滤,能够在一定程度上避免被套和错过行情。具体来说,主要具有以下几个优势:
- 短线RSI背离信号能提前判断价格反转机会,及时捕捉行情转折点;
- 长线RSI过滤条件避免在趋势不确定时盲目做多;
- 多种类型的止盈方式,分批止盈有利于减少风险;
- Pyramiding机制允许加仓,进一步提高盈利空间。
策略风险
该策略也存在一些风险需要注意:
- RSI背离并不总是有效,有可能出现假信号;
- 加仓后风险会放大。如果判断错误,亏损会加速扩大;
- 止盈设置不当也可能导致过早止盈或盈利不足。
对应风险管理措施包括:合理设定止损止盈条件、控制每个头寸大小、分批减仓以平滑盈亏曲线等。
优化方向
该策略还存在进一步优化的空间:
- RSI参数可以进一步优化,找到最佳参数组合;
- 可以测试其他指标的背离信号,如MACD、KD等;
- 可以在特定品种(如原油、贵金属等)上专门优化参数,提高适应性。
总结
本策略综合运用短线与长线RSI的多空背离信号,在控制风险的同时,提高盈利效率。它体现了量化交易策略设计的多项原则,包括何时入场、何时离场、分批建仓减仓、设置止损止盈等。这是一个可供参考借鉴的RSI背离策略范例。
策略源码
/*backtest
start: 2023-11-20 00:00:00
end: 2023-11-27 00:00:00
period: 5m
basePeriod: 1m
exchanges: [{"eid":"Futures_Binance","currency":"BTC_USDT"}]
*/

// This source code is subject to the terms of the Mozilla Public License 2.0 at https://mozilla.org/MPL/2.0/
// © mohanee

//@version=4

//GOOGL setting  5 ,50 close, 3 , 1  profitLevel at 75 and No stop Loss shows win rate 99.03 % profit factor 5830.152

strategy(title="RSI5_50 with Divergence", overlay=false,pyramiding=2, default_qty_type=strategy.fixed, default_qty_value=3,    initial_capital=10000, currency=currency.USD)

len = input(title="RSI Period", minval=1, defval=5)
longRSILen = input(title="Long RSI Period", minval=10, defval=50)
src = input(title="RSI Source", defval=close)
lbR = input(title="Pivot Lookback Right", defval=3)
lbL = input(title="Pivot Lookback Left", defval=1)
takeProfitRSILevel = input(title="Take Profit at RSI Level", minval=50, defval=75)
stopLoss = input(title="Stop Loss%(if checked 8% rule applied)", defval=false)

shortTermRSI = rsi(close,len)
longTermRSI = rsi(close,longRSILen)

rangeUpper = input(title="Max of Lookback Range", defval=60)
rangeLower = input(title="Min of Lookback Range", defval=5)
plotBull = input(title="Plot Bullish", defval=true)
plotHiddenBull = input(title="Plot Hidden Bullish", defval=true)
plotBear = input(title="Plot Bearish", defval=true)
plotHiddenBear = input(title="Plot Hidden Bearish", defval=false)


bearColor = color.purple
bullColor = color.green
hiddenBullColor = color.new(color.green, 80)
hiddenBearColor = color.new(color.red, 80)
textColor = color.white
noneColor = color.new(color.white, 100)


plot(shortTermRSI, title="RSI", linewidth=2, color=#8D1699)
plot(longTermRSI, title="longTermRSI", linewidth=2, color=color.orange)

hline(50, title="Middle Line", linestyle=hline.style_dotted)
obLevel = hline(70, title="Overbought", linestyle=hline.style_dotted)
osLevel = hline(30, title="Oversold", linestyle=hline.style_dotted)
fill(obLevel, osLevel, title="Background", color=longTermRSI >=50 ? color.green:color.purple, transp=65)  // longTermRSI >=50

plFound = na(pivotlow(shortTermRSI, lbL, lbR)) ? false : true
phFound = na(pivothigh(shortTermRSI, lbL, lbR)) ? false : true

_inRange(cond) =>
    bars = barssince(cond == true)
    rangeLower <= bars and bars <= rangeUpper

//------------------------------------------------------------------------------
// Regular Bullish

// shortTermRSI: Higher Low
oscHL = shortTermRSI[lbR] > valuewhen(plFound, shortTermRSI[lbR], 1) and _inRange(plFound[1])

// Price: Lower Low
priceLL = low[lbR] < valuewhen(plFound, low[lbR], 1)

bullCond = plotBull and priceLL and oscHL and plFound

plot(
	 plFound ? shortTermRSI[lbR] : na,
	 offset=-lbR,
	 title="Regular Bullish",
	 linewidth=2,
	 color=(bullCond ? bullColor : noneColor),
	 transp=0
	 )


plotshape(
	 bullCond ? shortTermRSI[lbR] : na,
	 offset=-lbR,
	 title="Regular Bullish Label",
	 text=" Bull ",
	 style=shape.labelup,
	 location=location.absolute,
	 color=bullColor,
	 textcolor=textColor,
	 transp=0
	 )

//------------------------------------------------------------------------------
// Hidden Bullish

// shortTermRSI: Lower Low
oscLL = shortTermRSI[lbR] < valuewhen(plFound, shortTermRSI[lbR], 1) and _inRange(plFound[1])

// Price: Higher Low
priceHL = low[lbR] > valuewhen(plFound, low[lbR], 1)

hiddenBullCond = plotHiddenBull and priceHL and oscLL and plFound

plot(
	 plFound ? shortTermRSI[lbR] : na,
	 offset=-lbR,
	 title="Hidden Bullish",
	 linewidth=2,
	 color=(hiddenBullCond ? hiddenBullColor : noneColor),
	 transp=0
	 )

plotshape(
	 hiddenBullCond ? shortTermRSI[lbR] : na,
	 offset=-lbR,
	 title="Hidden Bullish Label",
	 text=" H Bull ",
	 style=shape.labelup,
	 location=location.absolute,
	 color=bullColor,
	 textcolor=textColor,
	 transp=0
	 )

longCondition= longTermRSI >=50  and ( (bullCond or hiddenBullCond ) )  or  (strategy.position_size>0 and crossover(shortTermRSI,20) )
//last condition above is to leg in if you are already in the Long trade,


strategy.entry(id="RSIDivLE", long=true,  when=longCondition)


//------------------------------------------------------------------------------
// Regular Bearish

// shortTermRSI: Lower High
oscLH = shortTermRSI[lbR] < valuewhen(phFound, shortTermRSI[lbR], 1) and _inRange(phFound[1])

// Price: Higher High
priceHH = high[lbR] > valuewhen(phFound, high[lbR], 1)

bearCond = plotBear and priceHH and oscLH and phFound

plot(
	 phFound ? shortTermRSI[lbR] : na,
	 offset=-lbR,
	 title="Regular Bearish",
	 linewidth=2,
	 color=(bearCond ? bearColor : noneColor),
	 transp=0
	 )

plotshape(
	 bearCond ? shortTermRSI[lbR] : na,
	 offset=-lbR,
	 title="Regular Bearish Label",
	 text=" Bear ",
	 style=shape.labeldown,
	 location=location.absolute,
	 color=bearColor,
	 textcolor=textColor,
	 transp=0
	 )

//------------------------------------------------------------------------------
// Hidden Bearish

// shortTermRSI: Higher High
oscHH = shortTermRSI[lbR] > valuewhen(phFound, shortTermRSI[lbR], 1) and _inRange(phFound[1])

// Price: Lower High
priceLH = high[lbR] < valuewhen(phFound, high[lbR], 1)

hiddenBearCond = plotHiddenBear and priceLH and oscHH and phFound

plot(
	 phFound ? shortTermRSI[lbR] : na,
	 offset=-lbR,
	 title="Hidden Bearish",
	 linewidth=2,
	 color=(hiddenBearCond ? hiddenBearColor : noneColor),
	 transp=0
	 )

plotshape(
	 hiddenBearCond ? shortTermRSI[lbR] : na,
	 offset=-lbR,
	 title="Hidden Bearish Label",
	 text=" H Bear ",
	 style=shape.labeldown,
	 location=location.absolute,
	 color=bearColor,
	 textcolor=textColor,
	 transp=0
	 )


//calculate stop Loss
stopLossVal = stopLoss==true ? ( strategy.position_avg_price -  (strategy.position_avg_price*0.08) ) : 0

//partial profit
strategy.close(id="RSIDivLE", comment="TP1", qty=strategy.position_size*3/4, when=strategy.position_size>0 and (longTermRSI>=takeProfitRSILevel or crossover(longTermRSI,90)))
strategy.close(id="RSIDivLE",comment="TP2",   qty=strategy.position_size*3/4 , when=crossover(longTermRSI,70))
strategy.close(id="RSIDivLE",comment="TP3",   qty=strategy.position_size/2, when=crossover(longTermRSI,65))
strategy.close(id="RSIDivLE",comment="TP4",   qty=strategy.position_size/2 , when=crossover(longTermRSI,60))

//close the whole position when stoploss hits or longTermRSI goes below 30
strategy.close(id="RSIDivLE",comment="Exit",    when=crossunder(longTermRSI,30) or close<stopLossVal)