Moving Average Relative Strength Index Strategy

Overview
The Moving Average Relative Strength Index Strategy is a quantitative trading strategy that utilizes both moving average lines and the Relative Strength Index (RSI) as trading signals to capture opportunities in market trends. This strategy generates trading signals by comparing the price moving average line with the value of the RSI index to catch reversal opportunities in the market.
Strategy Logic
This strategy is mainly based on two indicators:
- Simple Moving Average (SMA): reflects the average trend of prices.
- Relative Strength Index (RSI): reflects the strength or weakness of price performance.
The core logic of the strategy is:
When the RSI indicator line is lower than the moving average line, it is in the oversold region and indicates the stock is underestimated, generating a buy signal. When the RSI line is higher than the moving average line, it is in the overbought region and signals the stock is overvalued, thus producing a sell signal.
In other words, the moving average line reflects the fair value of the stock to some extent, while the RSI indicator represents the current strength or weakness of the price. When the RSI diverges from the moving average line, it implies a reversal opportunity.
Specifically, this strategy generates trading signals through the following steps:
- Calculate the RSI value and simple moving average of the stock price.
- Compare the relationship between the RSI value and the moving average line.
- A sell signal is generated when the RSI line crosses above the moving average line.
- A buy signal is triggered when the RSI line crosses below the moving average line.
- Set stop loss and trailing stop to control risks.
Advantages of the Strategy
By combining the trend judgment of moving averages and the overbought/oversold indication of RSI, this strategy can effectively determine inflection points in the market by leveraging the strengths of different indicators.
The main advantages are:
- Moving averages can effectively indicate price trends.
- RSI can reflect overbought/oversold conditions.
- The combination of dual indicators improves the accuracy of identifying market turning points.
- Stop loss can be used to control risks.
Risks of the Strategy
There are also some risks with this strategy:
- There is a probability of false signals from the indicators, which may cause unnecessary losses.
- Stop loss may be triggered during violent market swings, leading to large losses.
- Improper parameter settings can also affect strategy performance.
To manage risks, optimizations can be made in the following ways:
- Adjust parameters of moving average and RSI to make indicator signals more reliable.
- Set stop loss appropriately wider to avoid too frequent triggering.
- Adopt dynamic trailing stop loss to make stop loss more flexible.
Directions for Strategy Optimization
Further optimization directions include:
- Test different parameter combinations across timeframes to find optimal parameters.
- Add other indicators like volume for filter to improve signal reliability.
- Optimize stop loss strategies to make stop loss more dynamic and reasonable.
- Incorporate deep learning models for adaptive parameter optimization.
- Add position sizing module to dynamically adjust positions based on market conditions.
Through parameter optimization, indicator optimization, risk management optimization etc, the stability and profitability of this strategy can be continuously improved.
Conclusion
The Moving Average RSI Strategy utilizes both price trend and overbought/oversold analysis to effectively identify market turning points and capture reversal opportunities. This simple, practical strategy has controllable risks and is useful for quantitative trading. Further optimization can lead to even better results.
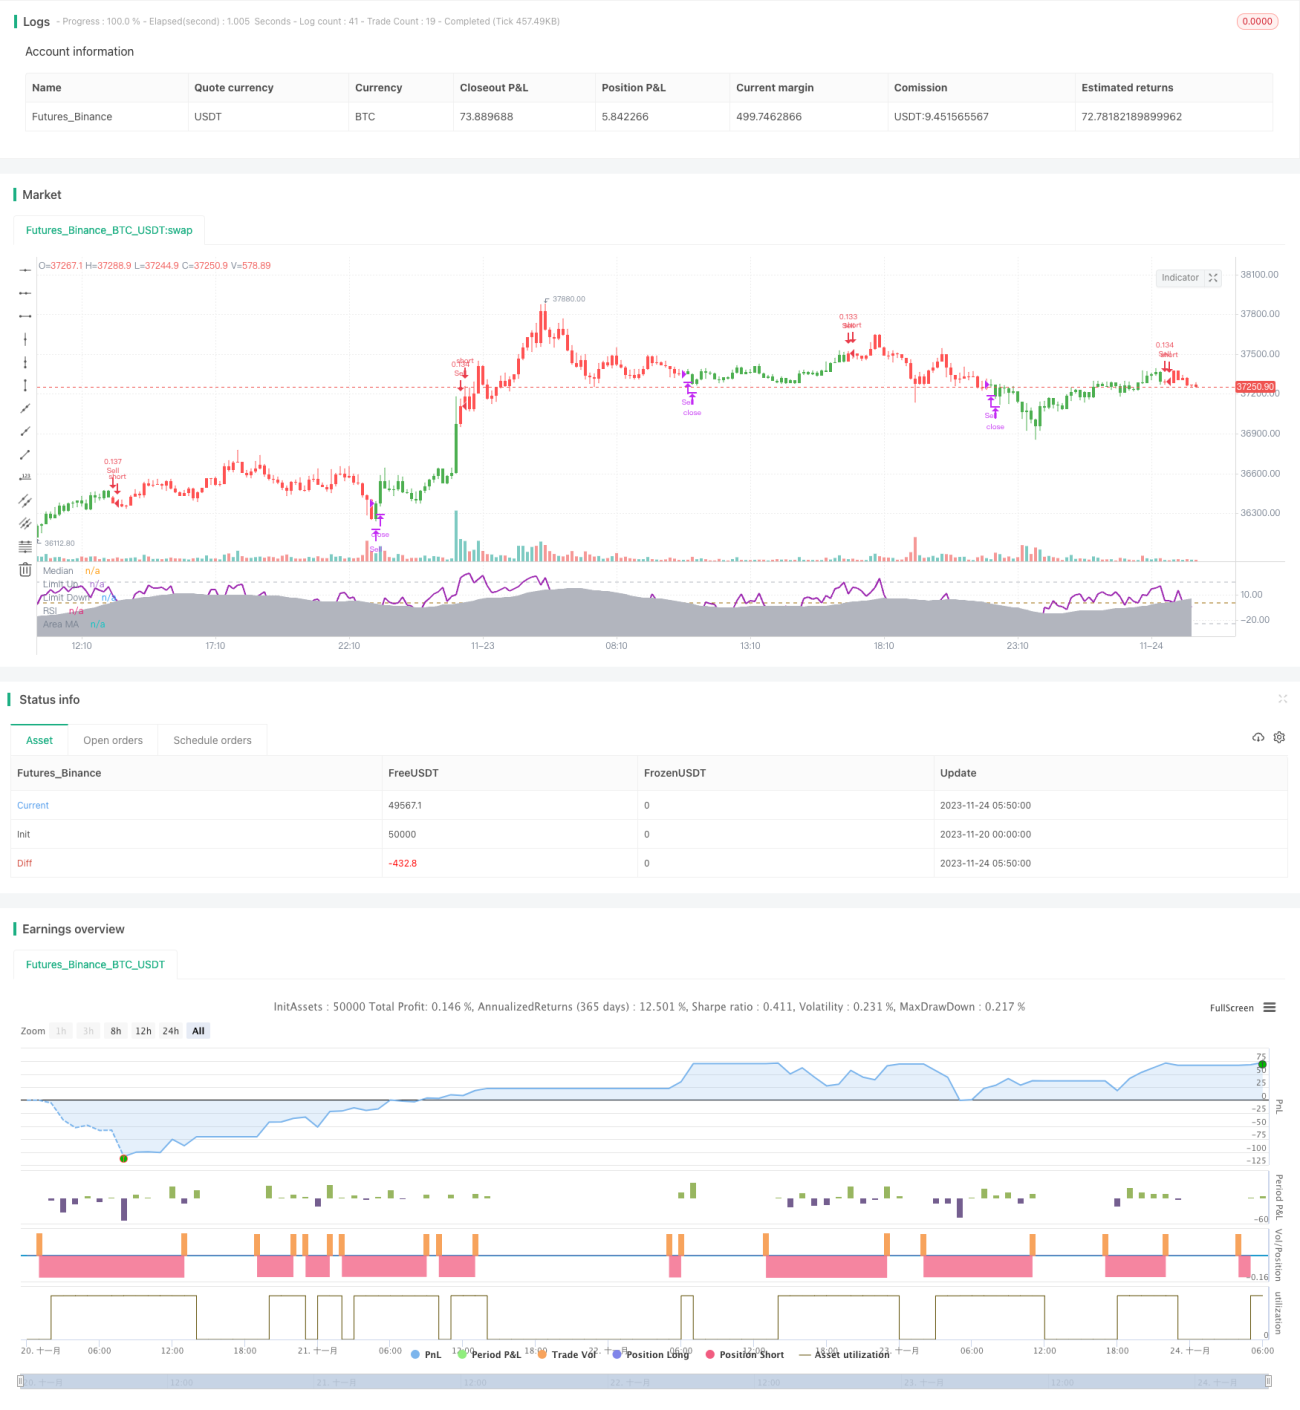
/*backtest
start: 2023-11-20 00:00:00
end: 2023-11-24 06:00:00
period: 10m
basePeriod: 1m
exchanges: [{"eid":"Futures_Binance","currency":"BTC_USDT"}]
*/

//@version=2

strategy(title = "RSI versus SMA", shorttitle = "RSI vs SMA", overlay = false, pyramiding = 0, default_qty_type = strategy.percent_of_equity, default_qty_value = 10, currency = currency.GBP)
- 1