SuperTrend Strategy with Trailing Stop Loss

Overview
This strategy designs a moving stop loss line and reversal line based on the Average True Range (ATR) indicator. It will trail the stop loss based on price movement. Specifically, if the price movement exceeds 1%, the stop loss will move towards the profit direction at a fixed proportion. When the price breaks through the stop loss line, the position will be closed automatically. This can lock in profits and reduce losses.
Strategy Logic
The strategy uses the ATR indicator to calculate the stop loss line. The specific formulas are:
pine
atr = multplierFactor * atr(barsBack)
longStop = hl2 - atr
shortStop = hl2 + atr
Where multplierFactor is the ATR multiplier, and barsBack is the ATR period. The larger the ATR value, the larger the market fluctuation.
The longStop and shortStop stop loss lines are calculated based on the ATR value. Trading signals are triggered when the price exceeds these two lines.
In addition, a direction variable is introduced to determine the trend direction:
            mylang

            direction = 1
direction := nz(direction[1], direction)
direction := direction == -1 and close > shortStopPrev ? 1 : direction == 1 and close < longStopPrev ? -1 : direction
If direction is 1, it indicates a bullish trend. If direction is -1, it indicates a bearish trend.
Based on the direction variable value, stop loss lines with different colors will be drawn:
            mylang

            if (direction == 1)
    valueToPlot := longStop
    colorToPlot := color.green
else
    valueToPlot := shortStop
    colorToPlot := color.red
This clearly shows the current trend direction and stop loss line position.
Trailing Stop Loss
The key point of this strategy is the introduction of a trailing stop loss mechanism that can adjust the stop loss line in real time based on price movement.
The specific logic is:
            mylang

            strategyPercentege = (close - updatedEntryPrice) / updatedEntryPrice * 100.00
rideUpStopLoss = hasOpenTrade() and strategyPercentege > 1

if (rideUpStopLoss)
    stopLossPercent := stopLossPercent + strategyPercentege - 1.0
    newStopLossPrice = updatedEntryPrice + (updatedEntryPrice * stopLossPercent) / 100
    stopLossPrice := max(stopLossPrice, newStopLossPrice)
    updatedEntryPrice := stopLossPrice
If the price rises more than 1% relative to the entry price, the stop loss will be trailed upwards. The adjustment range is the part exceeded 1%.
This can lock in more profits while reducing losses.
Advantage Analysis
Compared with traditional moving stop loss strategies, the biggest advantage of this strategy is that it can dynamically adjust the stop loss line according to market conditions. The specific advantages are:
-
Achieve higher profit locking in trending markets
The trailing stop loss mechanism allows the stop loss line to keep moving towards the profit direction. This locks in higher profits when the market continues to strengthen.
-
Reduce the risk of stop loss gapping in range-bound markets
When market trends change, fixed moving stop losses are prone to being skipped. While the stop loss line of this strategy is calculated based on market volatility, which can reasonably track price changes and avoid being skipped in consolidation.
-
Simple operation, easy to automate
This strategy is entirely based on indicator calculation without complex trend judgment logic. It can be easily automated.
-
Customizable parameters suitable for different products
Parameters like ATR period, multiplier factor, stop loss percentage can be customized. The strategy can be optimized for different products to make it more versatile.
Risk Analysis
Although the strategy has many advantages, the following risks should be noted:
-
Unable to determine trend reversal points, there is risk of buying high and selling low
There is no logic in this strategy to determine if the trend has ended. It is prone to buying high and selling low at the end of a bull market.
-
Improper parameter settings may amplify losses
If the ATR period parameter is set too short, the stop loss line will be too sensitive and may be frequently triggered by oscillating markets.
-
Risk of being stopped out from bottom-fishing rebounds
This strategy does not consider significant points as stop loss support. So it may also be thrown out of the market during short-term pullbacks.
To address the above risks, optimization can be done in the following aspects:
-
Incorporate trend filtering indicators to predict trend reversal in advance
-
Parameter optimization testing to select the optimal parameter combination
-
Widen the stop loss range near certain support levels
Optimization Directions
There is room for further optimization of this strategy:
-
Incorporate candlestick pattern recognition
Identify some typical candlestick patterns like divergence and shooting star to judge the possibility of trend reversal. This can avoid the risk of buying high and selling low.
-
Dynamic optimization of trailing parameters
Allow parameters like ATR period and multiplier factor to change dynamically. Use longer ATR periods and wider stop loss ranges in largely fluctuating markets.
-
Incorporate machine learning models
Use LSTM, RNN and other deep learning models to predict possible future price ranges and dynamically adjust stop loss distances.
Summary
In summary, this strategy utilizes the ATR indicator to design a moving stop loss line, and introduces a trailing stop loss mechanism that can adjust the stop loss position in real time based on market changes. This achieves higher profit locking while also reducing risks. With further optimizations, this strategy can become more adaptive to various market situations and serve as a robust trading strategy.
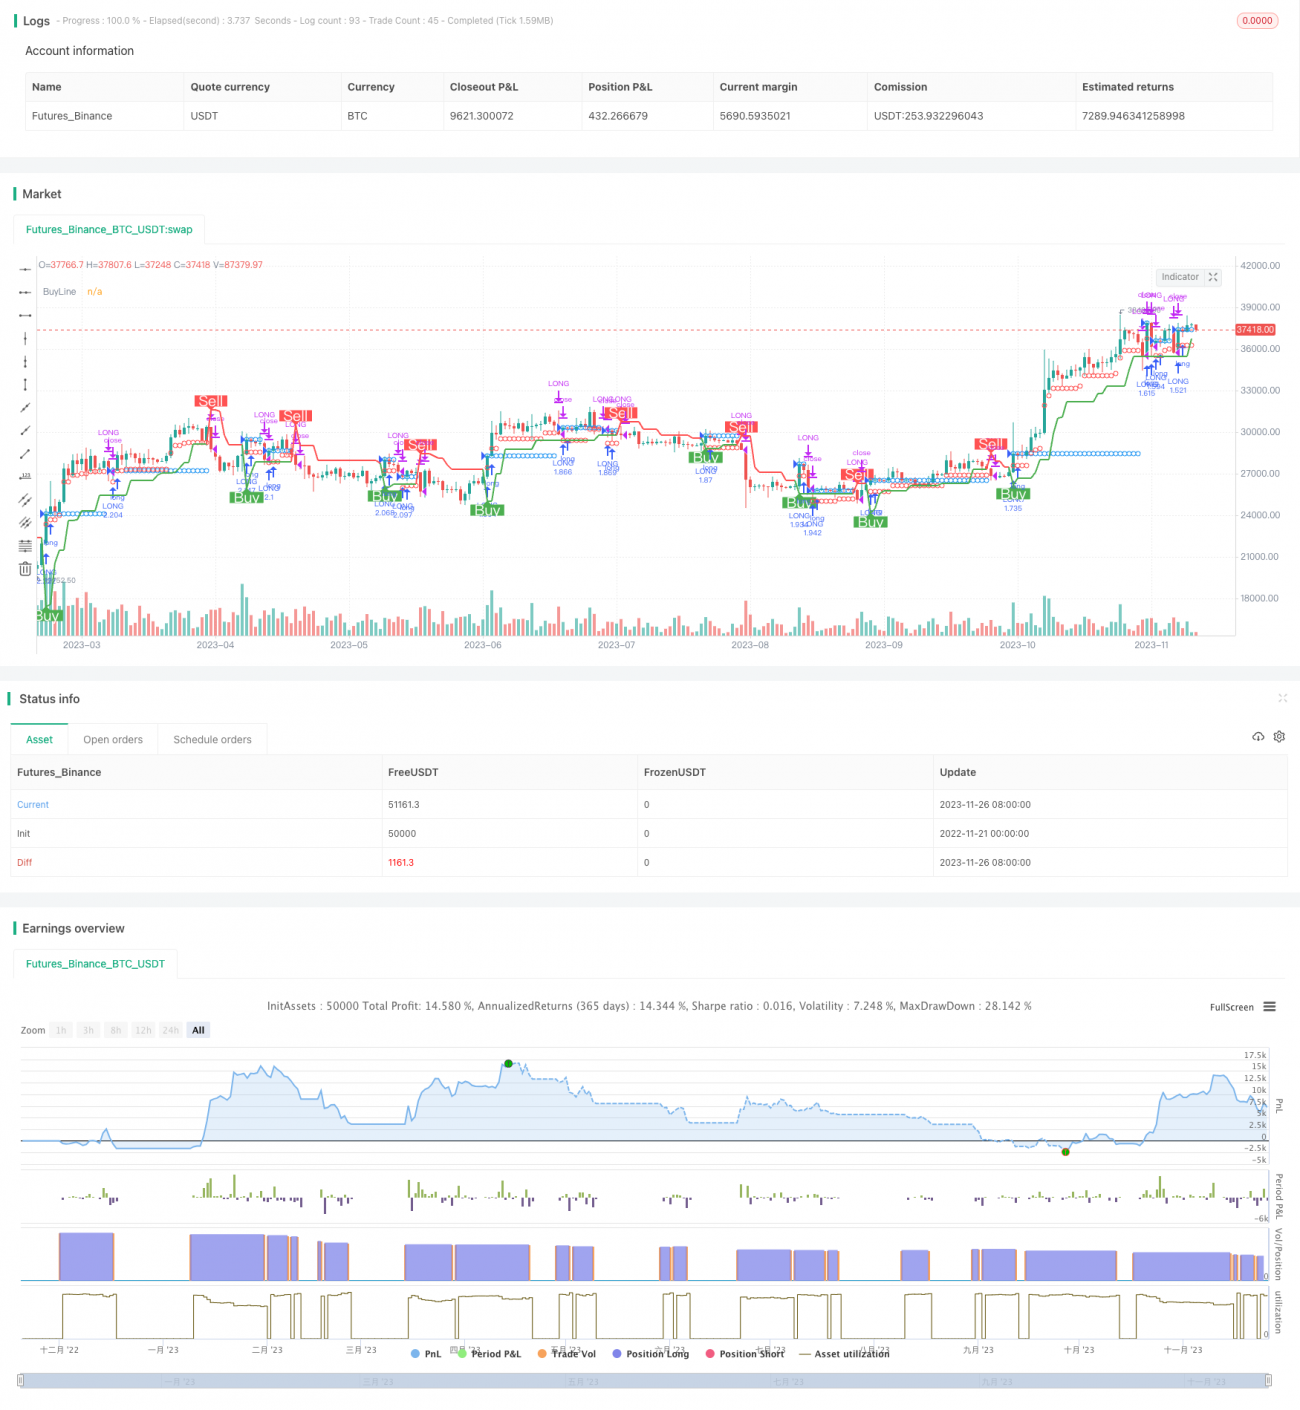
/*backtest
start: 2022-11-21 00:00:00
end: 2023-11-27 00:00:00
period: 1d
basePeriod: 1h
exchanges: [{"eid":"Futures_Binance","currency":"BTC_USDT"}]
*/

//@version=4
//
// ▒▒▒▒▒▒▒▒▒▒▒▒▒▒▒▒▒▒▒▒▒▒▒▒▒▒▒▒▒▒▒▒▒▒▒▒▒▒▒▒▒▒▒▒▒▒▒▒▒▒▒▒▒▒▒▒▒▒▒▒▒▒▒▒▒▒▒▒▒▒▒▒▒▒▒▒▒▒▒▒▒▒▒▒▒▒▒▒▒▒▒▒▒▒▒▒▒▒▒▒▒▒▒▒▒▒▒▒▒▒▒▒▒▒
// ------------------------------------------------------------------------------ 1