Multi RSI Indicators Trading Strategy

Author: ChaoZhang, Date: 2023-11-28 15:03:53
Tags:

img

Overview

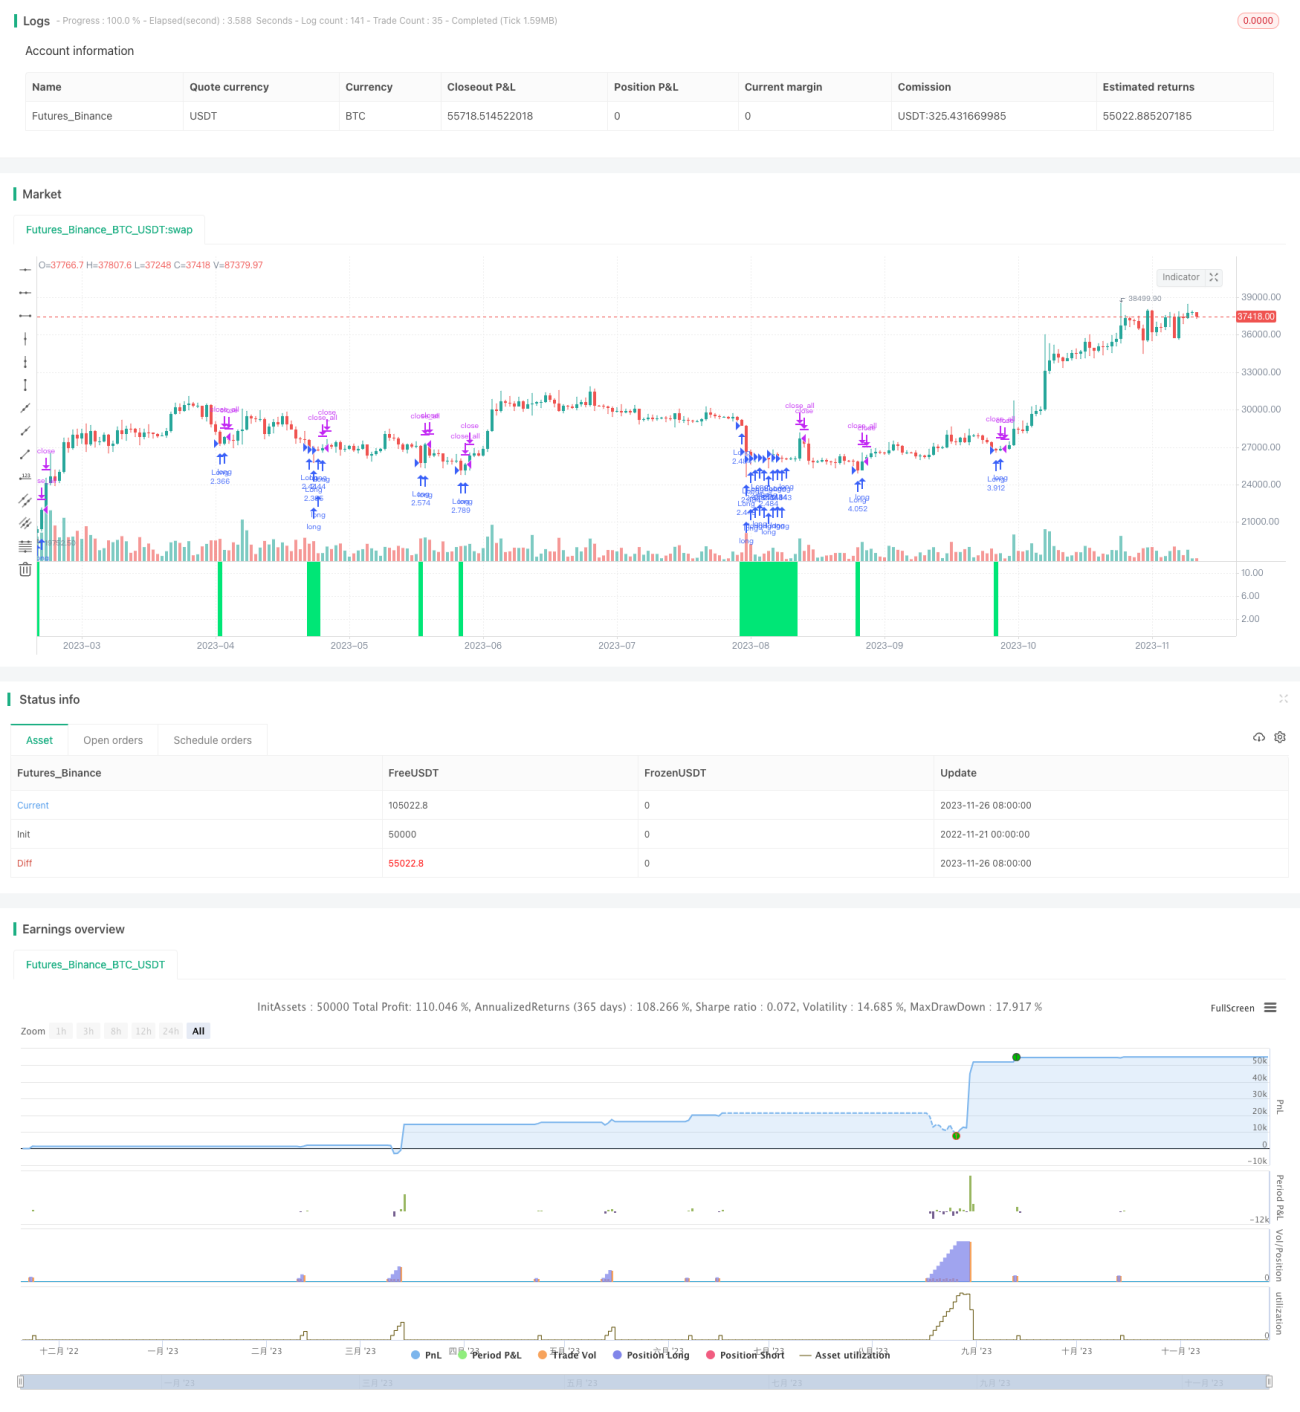
The multi RSI indicators trading strategy identifies trading opportunities by combining multiple RSI indicators to track trends. The strategy flexibly utilizes 1-5 RSI indicators and determines entry and exit timing according to the indicator values.

Strategy Logic

The strategy allows selecting 1-5 RSI indicators through input parameters. Each RSI indicator can be configured independently with period and limit values. When any RSI drops below the limit value, a buy signal is triggered. The signal strength is determined by the period of the triggered RSI indicator, with higher period meaning stronger signal. When RSI rises back above the limit, a close position signal is triggered. The strategy also provides flexibility to use color filter and restrict trading hours.

Advantage Analysis

The biggest advantage of this strategy is the capability to assess multiple timeframes using various RSIs, judging both trend and reversal opportunities from long and short dimensions to improve accuracy. In addition, the flexible configuration of each RSI indicator greatly expands the adaptivity across different markets. Fake breakouts can also be efficiently filtered out using color filters. Risk control modules like trading hours and position sizing provide effective risk management.

Risk Analysis

The major risk is conflicting signals when combining multiple RSI judgments. For instance, shorter RSI produces a buy whilst longer RSI is still oversold. One must rely on experience to determine which signal takes precedence. Also, RSI is prone to whipsaws which requires validation using other indicators or large accounts.

Optimization Directions

The strategy can consider adding trend assisting indicators like moving averages or Bollinger bands to validate RSI signals and improve accuracy. Additionally, certain machine learning algorithms can also be explored, using multi-factor scoring to automatically determine signal reliability. For risk control, floating loss or maximum drawdown stop lines can be implemented for stop loss purposes.

Summary

In summary, the multi RSI indicators trading strategy is very innovative. Its flexibility in indicators combination and parameters makes it adaptable to evolving markets. Further improvements can be achieved by incorporating machine learning algorithms and more risk control measures given its modular design.


/*backtest
start: 2022-11-21 00:00:00
end: 2023-11-27 00:00:00
period: 1d
basePeriod: 1h
exchanges: [{"eid":"Futures_Binance","currency":"BTC_USDT"}]
*/

//Noro
//2018
//@version=2

strategy(title = "Noro's Symphony Strategy v1.1", shorttitle = "Symphony str 1.1", overlay = false, default_qty_type = strategy.percent_of_equity, default_qty_value = 100, pyramiding = 20)

//Settings

//needlong = input(true, defval = true, title = "Long")
//needshort = input(true, defval = true, title = "Short")

capital = input(100, defval = 100, minval = 1, maxval = 10000, title = "Lot, %")
usersi1 = input(true, defval = true, title = "Use RSI 1")
rsiperiod1 = input(4, defval = 4, minval = 2, maxval = 100, title = "RSI 1 Period")
rsilimit1 = input(20, defval = 20, minval = 2, maxval = 50, title = "RSI 1 Limit")
usersi2 = input(true, defval = true, title = "Use RSI 2")
rsiperiod2 = input(7, defval = 7, minval = 2, maxval = 100, title = "RSI 2 Period")
rsilimit2 = input(25, defval = 25, minval = 2, maxval = 50, title = "RSI 2 Limit")
usersi3 = input(true, defval = true, title = "Use RSI 3")
rsiperiod3 = input(14, defval = 14, minval = 2, maxval = 100, title = "RSI 3 Period")
rsilimit3 = input(30, defval = 30, minval = 2, maxval = 50, title = "RSI 3 Limit")
usersi4 = input(false, defval = false, title = "Use RSI 4")
rsiperiod4 = input(21, defval = 21, minval = 2, maxval = 100, title = "RSI 4 Period")
rsilimit4 = input(35, defval = 35, minval = 2, maxval = 50, title = "RSI 4 Limit")
usersi5 = input(false, defval = false, title = "Use RSI 5")
rsiperiod5 = input(28, defval = 28, minval = 2, maxval = 100, title = "RSI 5 Period")
rsilimit5 = input(40, defval = 40, minval = 2, maxval = 50, title = "RSI 5 Limit")
cf = input(false, defval = false, title = "Use color filter")
fromyear = input(1900, defval = 1900, minval = 1900, maxval = 2100, title = "From Year")
toyear = input(2100, defval = 2100, minval = 1900, maxval = 2100, title = "To Year")
frommonth = input(01, defval = 01, minval = 01, maxval = 12, title = "From Month")
tomonth = input(12, defval = 12, minval = 01, maxval = 12, title = "To Month")
fromday = input(01, defval = 01, minval = 01, maxval = 31, title = "From Day")
today = input(31, defval = 31, minval = 01, maxval = 31, title = "To Day")

//RSI
rsi1 = rsi(close, rsiperiod1)
rsi2 = rsi(close, rsiperiod2)
rsi3 = rsi(close, rsiperiod3)
rsi4 = rsi(close, rsiperiod4)
rsi5 = rsi(close, rsiperiod5)

//Signals
up1 = rsi1 < rsilimit1 and usersi1  
up2 = rsi2 < rsilimit2 and usersi2
up3 = rsi3 < rsilimit3 and usersi3
up4 = rsi4 < rsilimit4 and usersi4
up5 = rsi5 < rsilimit5 and usersi5

str = up5 ? 5 : up4 ? 4 : up3 ? 3 : up2 ? 2 : up1 ? 1 : str[1]
up = up1 or up2 or up3 or up4 or up5
exit = (rsi1 > rsilimit1 and str == 1) or (rsi2 > rsilimit2 and str == 2) or (rsi3 > rsilimit3 and str == 3) or (rsi4 > rsilimit4 and str == 4) or (rsi5 > rsilimit5 and str == 5)
lot = strategy.position_size == 0 ? strategy.equity / close * capital / 100 : lot[1]

//Background
col = up ? lime : na
bgcolor(col, transp = 0)

//Trading
if up and (close < open or cf == false)
    strategy.entry("Long", strategy.long, lot, when=(time > timestamp(fromyear, frommonth, fromday, 00, 00) and time < timestamp(toyear, tomonth, today, 23, 59)))
 
if time > timestamp(toyear, tomonth, today, 23, 59) or exit
    strategy.close_all()

More