基于RSI和ATR通道的超级scalping策略

Super Scalping Strategy Based on RSI and ATR Channel
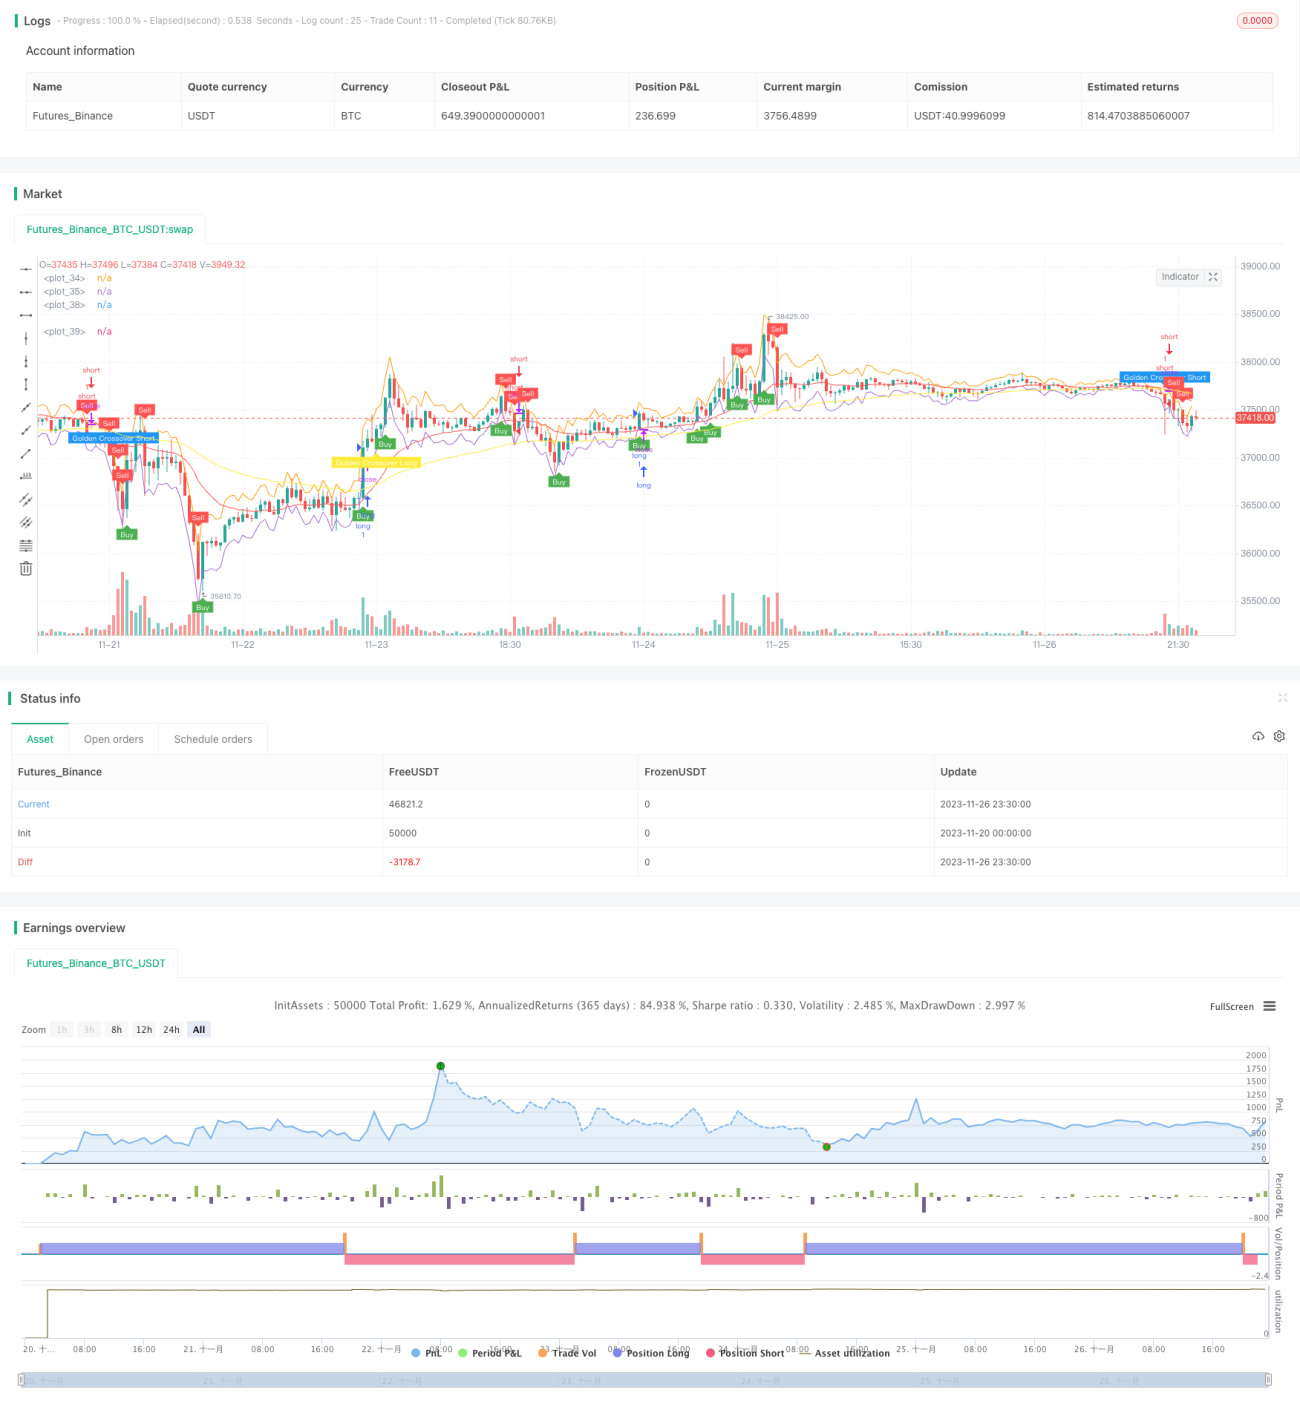
Overview
This strategy is based on Relative Strength Index (RSI) and Average True Range (ATR) channel, suitable for 5-min and 15-min timeframes, belonging to super scalping strategy type. It determines long/short direction entry points through RSI indicator and utilizes ATR channel to set stop loss and take profit, realizing high frequency trading.
Strategy Principle
- Use 21-day Exponential Moving Average (EMA) and 65-day EMA to form golden cross and dead cross, judging the major trend direction.
- When RSI is below 50, it is bearish; when above 50, it is bullish, sending out buy and sell signals.
- The upper and lower bands of ATR channel are: close+ATR and close-ATR. Sell when close breaks through the upper band of ATR and buy when it breaks through the lower band.
- Set stop loss at 2 times ATR and take profit at 5 times ATR.
Advantage Analysis
- Using golden cross and dead cross to determine major trend, avoiding trading against the trend.
- RSI can identify better entry timing.
- ATR channel sets stop loss and take profit points effectively, greatly improving profit-loss ratio.
- Suitable for high frequency scalping trading with quick profits.
Risk Analysis
- Need to watch the market closely, otherwise missing entry or stop loss points may lead to huge loss.
- In trending market, multiple add-on positions may occur, needing good control of position sizing.
- Enough capital is required to support frequent trading.
Optimization Direction
- Optimize ATR parameters for more reasonable stop loss and take profit.
- Add other indicator filters to improve entry quality.
- Add auto stop loss and take profit functions.
- Include capital management and position sizing control modules.
Summary
This strategy belongs to high frequency scalping trading type. It sets entry and exit points through RSI indicator and ATR channel for quick trades. The advantages are quick profit with good risk control, suitable for trading along the trend. However, close market watch is needed with enough capital supporting frequent trades. Overall speaking, this strategy performs well for trend trading and could be further improved on profitability through optimization.
- 1