Dual EMA Crossover Breakout Strategy

Overview
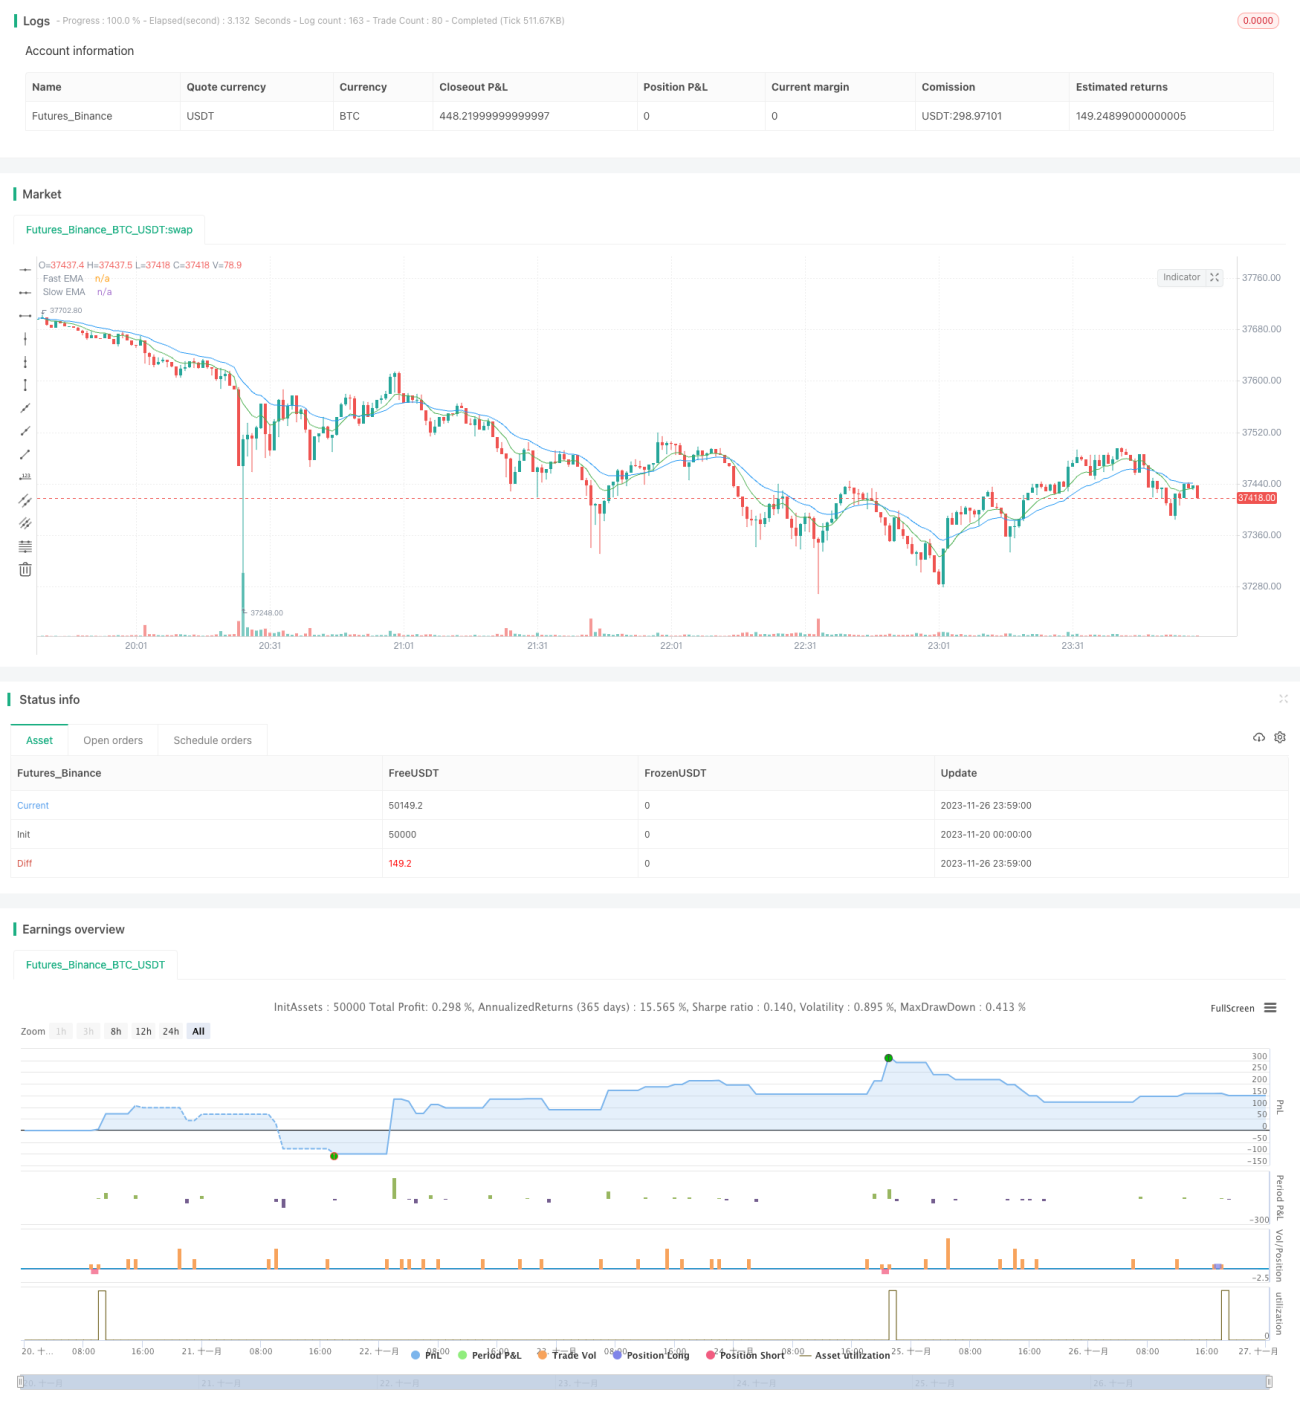
The Dual EMA Crossover Breakout strategy generates buy and sell signals based on the crossover of fast and slow EMA lines, combined with trading volume breakout, candlestick patterns and price breakout filters to improve reliability. By integrating multiple technical indicators, it aims to identify trends while controlling risks.
Principles
The core logic of the Dual EMA Crossover Breakout strategy lies in the golden crossover theory of two EMAs. The theory believes that when the shorter-term EMA crosses above the longer-term EMA, it signals an uptrend, so long positions should be established. When the shorter-term EMA crosses below the longer-term EMA, it signals a downtrend, so short positions should be established.
Specifically, the strategy first calculates the 9-period and 21-period EMAs. When the 9-EMA crosses above the 21-EMA, a "long" signal is generated. When the 9-EMA crosses below the 21-EMA, a "short" signal is generated. To filter out false signals, the following conditions are checked:
-
Volume condition - Volume of recent candle should exceed 85% of average volume of previous 5 candles. This filters out signals with insufficient trading volumes.
-
Price breakout condition - Price needs to breakout above 9-EMA as entry confirmation.
-
Candlestick pattern condition - Identify bullish or bearish reversal patterns, avoiding whipsaws during sideways markets.
For long positions, exits are triggered when price breaks below 9-EMA. For short positions, exits are triggered when price breaks above 9-EMA.
Advantage Analysis
By combining signals from multiple technical indicators, the Dual EMA Crossover Breakout strategy can effectively identify trends and improve win rate. The main advantages are:
-
Using dual EMAs to determine major trend direction is highly reliable.
-
Adding volume filter avoids wrong signals when volume is insufficient.
-
Adding candlestick pattern filter eliminates noise from range-bound markets.
-
Entering after price breaks EMA confirms trend.
-
The stop loss mechanism actively controls risks.
Risk Analysis
There are still some risks with the strategy:
-
EMA may generate false signals during choppy markets, causing losses. Overall trend judgement can help decide on opening positions.
-
Fixed EMA periods may fail to adapt to changing markets. Adaptive EMAs can be tested.
-
There are still probabilities of misidentifying candlestick patterns. Stop losses control risk.
-
The strategy may miss some price moves and have imperfect trend tracking. Parameter tuning or combining with other strategies can help.
Optimization Directions
The main optimization directions are:
-
Test more EMA combinations to find optimal parameters.
-
Add adaptive EMAs based on changing market conditions.
-
Optimize position sizing for different market conditions.
-
Incorporate more indicators like MACD, KDJ to form ensemble strategies.
-
Introduce machine learning models to improve robustness.
Conclusion
The Dual EMA Crossover Breakout strategy effectively identifies trends using dual EMA directional analysis, and adds multiple volume/price/pattern filters to improve efficiency while controlling risks. Easy to implement with optimization flexibility, it is a recommended breakout trend following strategy.
- 1