TSI and CCI Hull Moving Average Trend Tracking Strategy

Overview
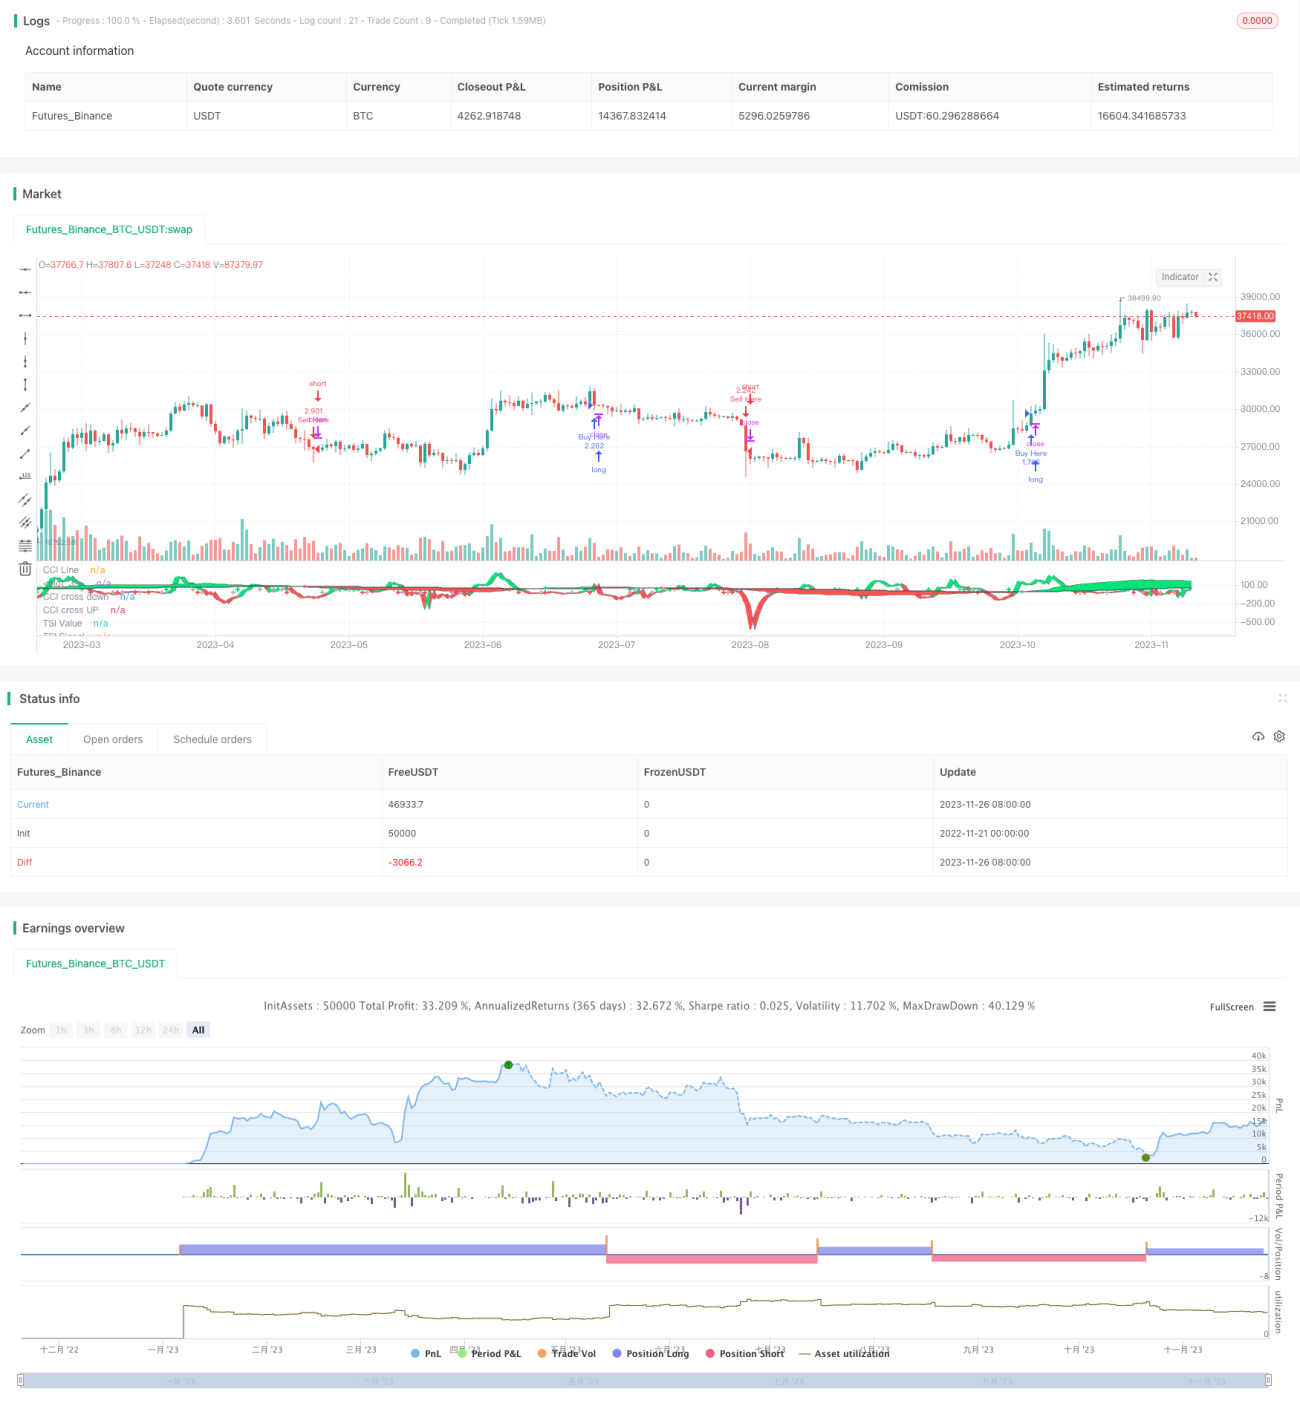
This strategy integrates the Relative Strength Index (TSI), Commodity Channel Index (CCI) and Hull Moving Average (Hull MA) indicators to form a trend tracking trading strategy. It can perform long-term tracking trades on any trading variety in hourly or higher time frames.
Strategy Principle
The strategy mainly uses the TSI and CCI indicators to judge the trend direction and overbought/oversold situations of the market, as well as the Hull MA to determine the intermediate trend of prices, and the three are combined as the basic conditions for opening positions.
Specifically, when the fast line of TSI crosses above the slow line, CCI indicator crosses above +20 && n1 rises, go long; when the fast line of TSI crosses below the slow line, CCI indicator crosses below -20 && n1 falls, go short. Hull MA is used to filter the intermediate trend, only going long when the price is below Hull MA, and going short when the price is above Hull MA.
By confirming with indicators across different cycles, false breakouts can be effectively filtered to track medium- and long-term trends.
Advantage Analysis
This is a relatively stable and efficient trend tracking strategy, with the following main advantages:
-
Using TSI to judge long-term trend directions is more reliable, avoiding interference from short-term market noise;
-
The addition of the CCI indicator can confirm overbought/oversold phenomena and filter out some false signals;
-
Hull MA’s judgement makes entry points more precise, greatly improving the probability of profit;
-
The integration of indicators with different parameters can improve the reliability of signals and reduce interference probability.
-
Flexible parameter settings of the strategy can be optimized for different market cycles.
Risk Analysis
Although the strategy is relatively stable, there are still some risks to note:
-
The market may experience violent reversals that cannot be quickly stopped for loss, causing relatively large losses;
-
TSI Diff and CCI indicators may both have false signals and lags, missing some entry points;
-
Improper parameter settings can also lead to excessively high trading frequency or decline in signal quality.
Countermeasures:
-
Adjust stop loss appropriately to control single loss;
-
Confirm with other indicators as appropriate to improve signal accuracy;
-
Adjust parameters according to market to ensure strategy stability.
Optimization Directions
The strategy can also be optimized in the following aspects:
-
Try different combinations of parameter indicators to find the best match;
-
Introduce machine learning algorithms to achieve adaptive optimization of parameters;
-
Increase capital management module for more stable profits;
-
Incorporate more filters to increase strategy win rate.
These will be the focuses for future optimizations.
Summary
This strategy comprehensively utilizes the TSI, CCI and Hull MA indicators to form a relatively stable and efficient trend tracking strategy. It successfully leverages the advantages of multi-cycle indicators to improve signal quality. The next step will be to further enhance the stability and profitability of the strategy through parameter optimization, filter enhancement and other means.
/*backtest
start: 2022-11-21 00:00:00
end: 2023-11-27 00:00:00
period: 1d
basePeriod: 1h
exchanges: [{"eid":"Futures_Binance","currency":"BTC_USDT"}]
*/

//@version=4

strategy(title="TSI CCI Hull", shorttitle="TSICCIHULL", default_qty_type=strategy.percent_of_equity, default_qty_value=100, calc_on_order_fills= false, calc_on_every_tick=true, pyramiding=0)
long = input(title="Long Length", type=input.integer, defval=50)- 1