Bitcoin Quantitative Band Trading Strategy Based on Multiple Timeframes

Author: ChaoZhang, Date: 2023-12-01 13:50:02
Tags:

img

Overview

This strategy identifies the price bands of Bitcoin by combining quantitative indicators across different timeframes, and conducts trend tracking trades. It adopts the 5-minute timeframe and aims for long-term holding of bands for profit.

Strategy Logic

  1. The RSI indicator calculated based on the daily timeframe weighs based on trading volume to filter false breakouts.
  2. The daily RSI indicator is smoothed by an EMA to build a quantitative band indicator.
  3. The 5-minute timeframe uses a combination of Linear Regression and HMA indicators to generate trading signals.
  4. By combining the quantitative band indicator and trading signals across timeframes, the strategy identifies mid-to-long-term price bands.

Advantage Analysis

  1. The volume-weighted RSI indicator can effectively identify true bands and filter false breakouts.
  2. The HMA indicator is more sensitive to price changes and can capture turns timely.
  3. Combining multiple timeframes leads to more accurate identification of mid-to-long-term bands.
  4. Trading on the 5-minute timeframe allows higher operation frequency.
  5. As a band tracking strategy, it does not require accurate picking of points and can hold for longer periods.

Risk Analysis

  1. Quantitative indicators may generate false signals, fundamental analysis is recommended.
  2. Bands may see midway reversals, stop-loss mechanisms should be in place.
  3. Signal delays may lead to missing best entry points.
  4. Profitable bands need longer holding periods, requiring capital pressure tolerance.

Optimization Directions

  1. Test effectiveness of RSI indicators with different parameters.
  2. Try introducing other auxiliary band indicators.
  3. Optimize HMA indicator length parameters.
  4. Add stop loss and take profit strategies.
  5. Adjust holding cycle for band trades.

Conclusion

This strategy effectively captures Bitcoin’s mid-to-long-term trends by coupling timeframes and band tracking. Compared to short-term trading, mid-to-long-term band trading sees smaller drawdowns and greater profit potential. Next steps involve further enhancing profitability and stability through parameter tuning and risk management additions.


/*backtest
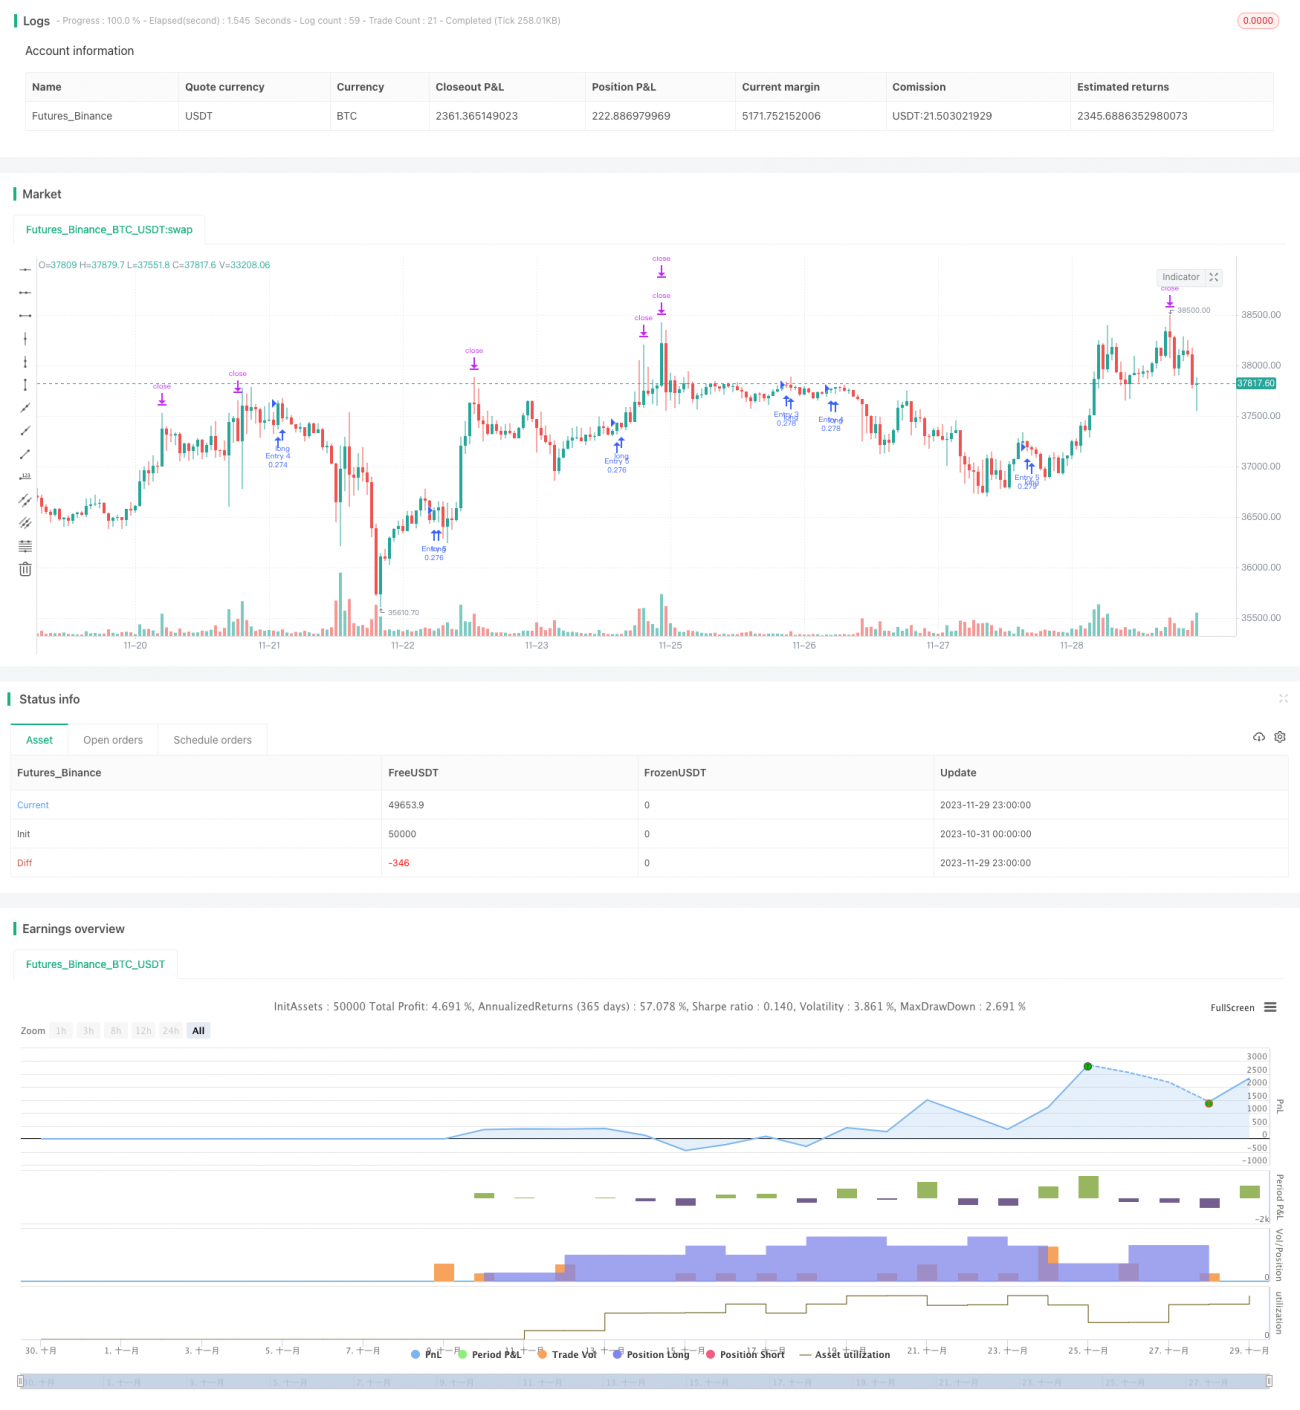
start: 2023-10-31 00:00:00
end: 2023-11-30 00:00:00
period: 1h
basePeriod: 15m
exchanges: [{"eid":"Futures_Binance","currency":"BTC_USDT"}]
*/

//@version=4

strategy(title='Pyramiding BTC 5 min', overlay=true, pyramiding=5, initial_capital=10000, default_qty_type=strategy.percent_of_equity, default_qty_value=20, commission_type=strategy.commission.percent, commission_value=0.075)
//the pyramide based on this script  https://www.tradingview.com/script/7NNJ0sXB-Pyramiding-Entries-On-Early-Trends-by-Coinrule/
//
fastLength = input(250, title="Fast filter length ", minval=1)
slowLength = input(500,title="Slow filter length",  minval=1)
source=close
v1=ema(source,fastLength)
v2=ema(source,slowLength)
//
//Backtest dates
fromMonth = input(defval=1, title="From Month")
fromDay = input(defval=10, title="From Day")
fromYear = input(defval=2020, title="From Year")
thruMonth = input(defval=1, title="Thru Month")
thruDay = input(defval=1, title="Thru Day")
thruYear = input(defval=2112, title="Thru Year")

showDate = input(defval=true, title="Show Date Range")

start = timestamp(fromYear, fromMonth, fromDay, 00, 00)  // backtest start window
finish = timestamp(thruYear, thruMonth, thruDay, 23, 59)  // backtest finish window
window() =>  // create function "within window of time"
    time >= start and time <= finish ? true : false


leng=1
p1=close[1]

len55 = 10
//taken from https://www.tradingview.com/script/Ql1FjjfX-security-free-MTF-example-JD/
HTF = input("1D", type=input.resolution)
ti = change( time(HTF) ) != 0
T_c = fixnan( ti ? close : na )

vrsi = rsi(cum(change(T_c) * volume), leng)
pp=wma(vrsi,len55)

d=(vrsi[1]-pp[1])
len100 = 10
x=ema(d,len100)
//
zx=x/-1
col=zx > 0? color.lime : color.orange

//

tf10 = input("1", title = "Timeframe", type = input.resolution, options = ["1", "5", "15", "30", "60","120", "240","360","720", "D", "W"])

length = input(50, title = "Period", type = input.integer)
shift = input(1, title = "Shift", type = input.integer)

hma(_src, _length)=>
    wma((2 * wma(_src, _length / 2)) - wma(_src, _length), round(sqrt(_length)))
    
hma3(_src, _length)=>
    p = length/2
    wma(wma(close,p/3)*3 - wma(close,p/2) - wma(close,p),p)

b =security(syminfo.tickerid, tf10, hma3(close[1], length)[shift])
//plot(a,color=color.gray)
//plot(b,color=color.yellow)
close_price = close[0]
len = input(25)

linear_reg = linreg(close_price, len, 0)


filter=input(true)

buy=crossover(linear_reg, b)

longsignal = (v1 > v2 or filter == false ) and buy and window()

//set take profit

ProfitTarget_Percent = input(3)
Profit_Ticks = close * (ProfitTarget_Percent / 100) / syminfo.mintick

//set take profit

LossTarget_Percent = input(10)
Loss_Ticks = close * (LossTarget_Percent / 100) / syminfo.mintick


//Order Placing

strategy.entry("Entry 1", strategy.long, when=strategy.opentrades == 0 and longsignal)

strategy.entry("Entry 2", strategy.long, when=strategy.opentrades == 1 and longsignal)

strategy.entry("Entry 3", strategy.long, when=strategy.opentrades == 2 and longsignal)

strategy.entry("Entry 4", strategy.long, when=strategy.opentrades == 3 and longsignal)

strategy.entry("Entry 5", strategy.long, when=strategy.opentrades == 4 and longsignal)


if strategy.position_size > 0
    strategy.exit(id="Exit 1", from_entry="Entry 1", profit=Profit_Ticks, loss=Loss_Ticks)
    strategy.exit(id="Exit 2", from_entry="Entry 2", profit=Profit_Ticks, loss=Loss_Ticks)
    strategy.exit(id="Exit 3", from_entry="Entry 3", profit=Profit_Ticks, loss=Loss_Ticks)
    strategy.exit(id="Exit 4", from_entry="Entry 4", profit=Profit_Ticks, loss=Loss_Ticks)
    strategy.exit(id="Exit 5", from_entry="Entry 5", profit=Profit_Ticks, loss=Loss_Ticks)


More