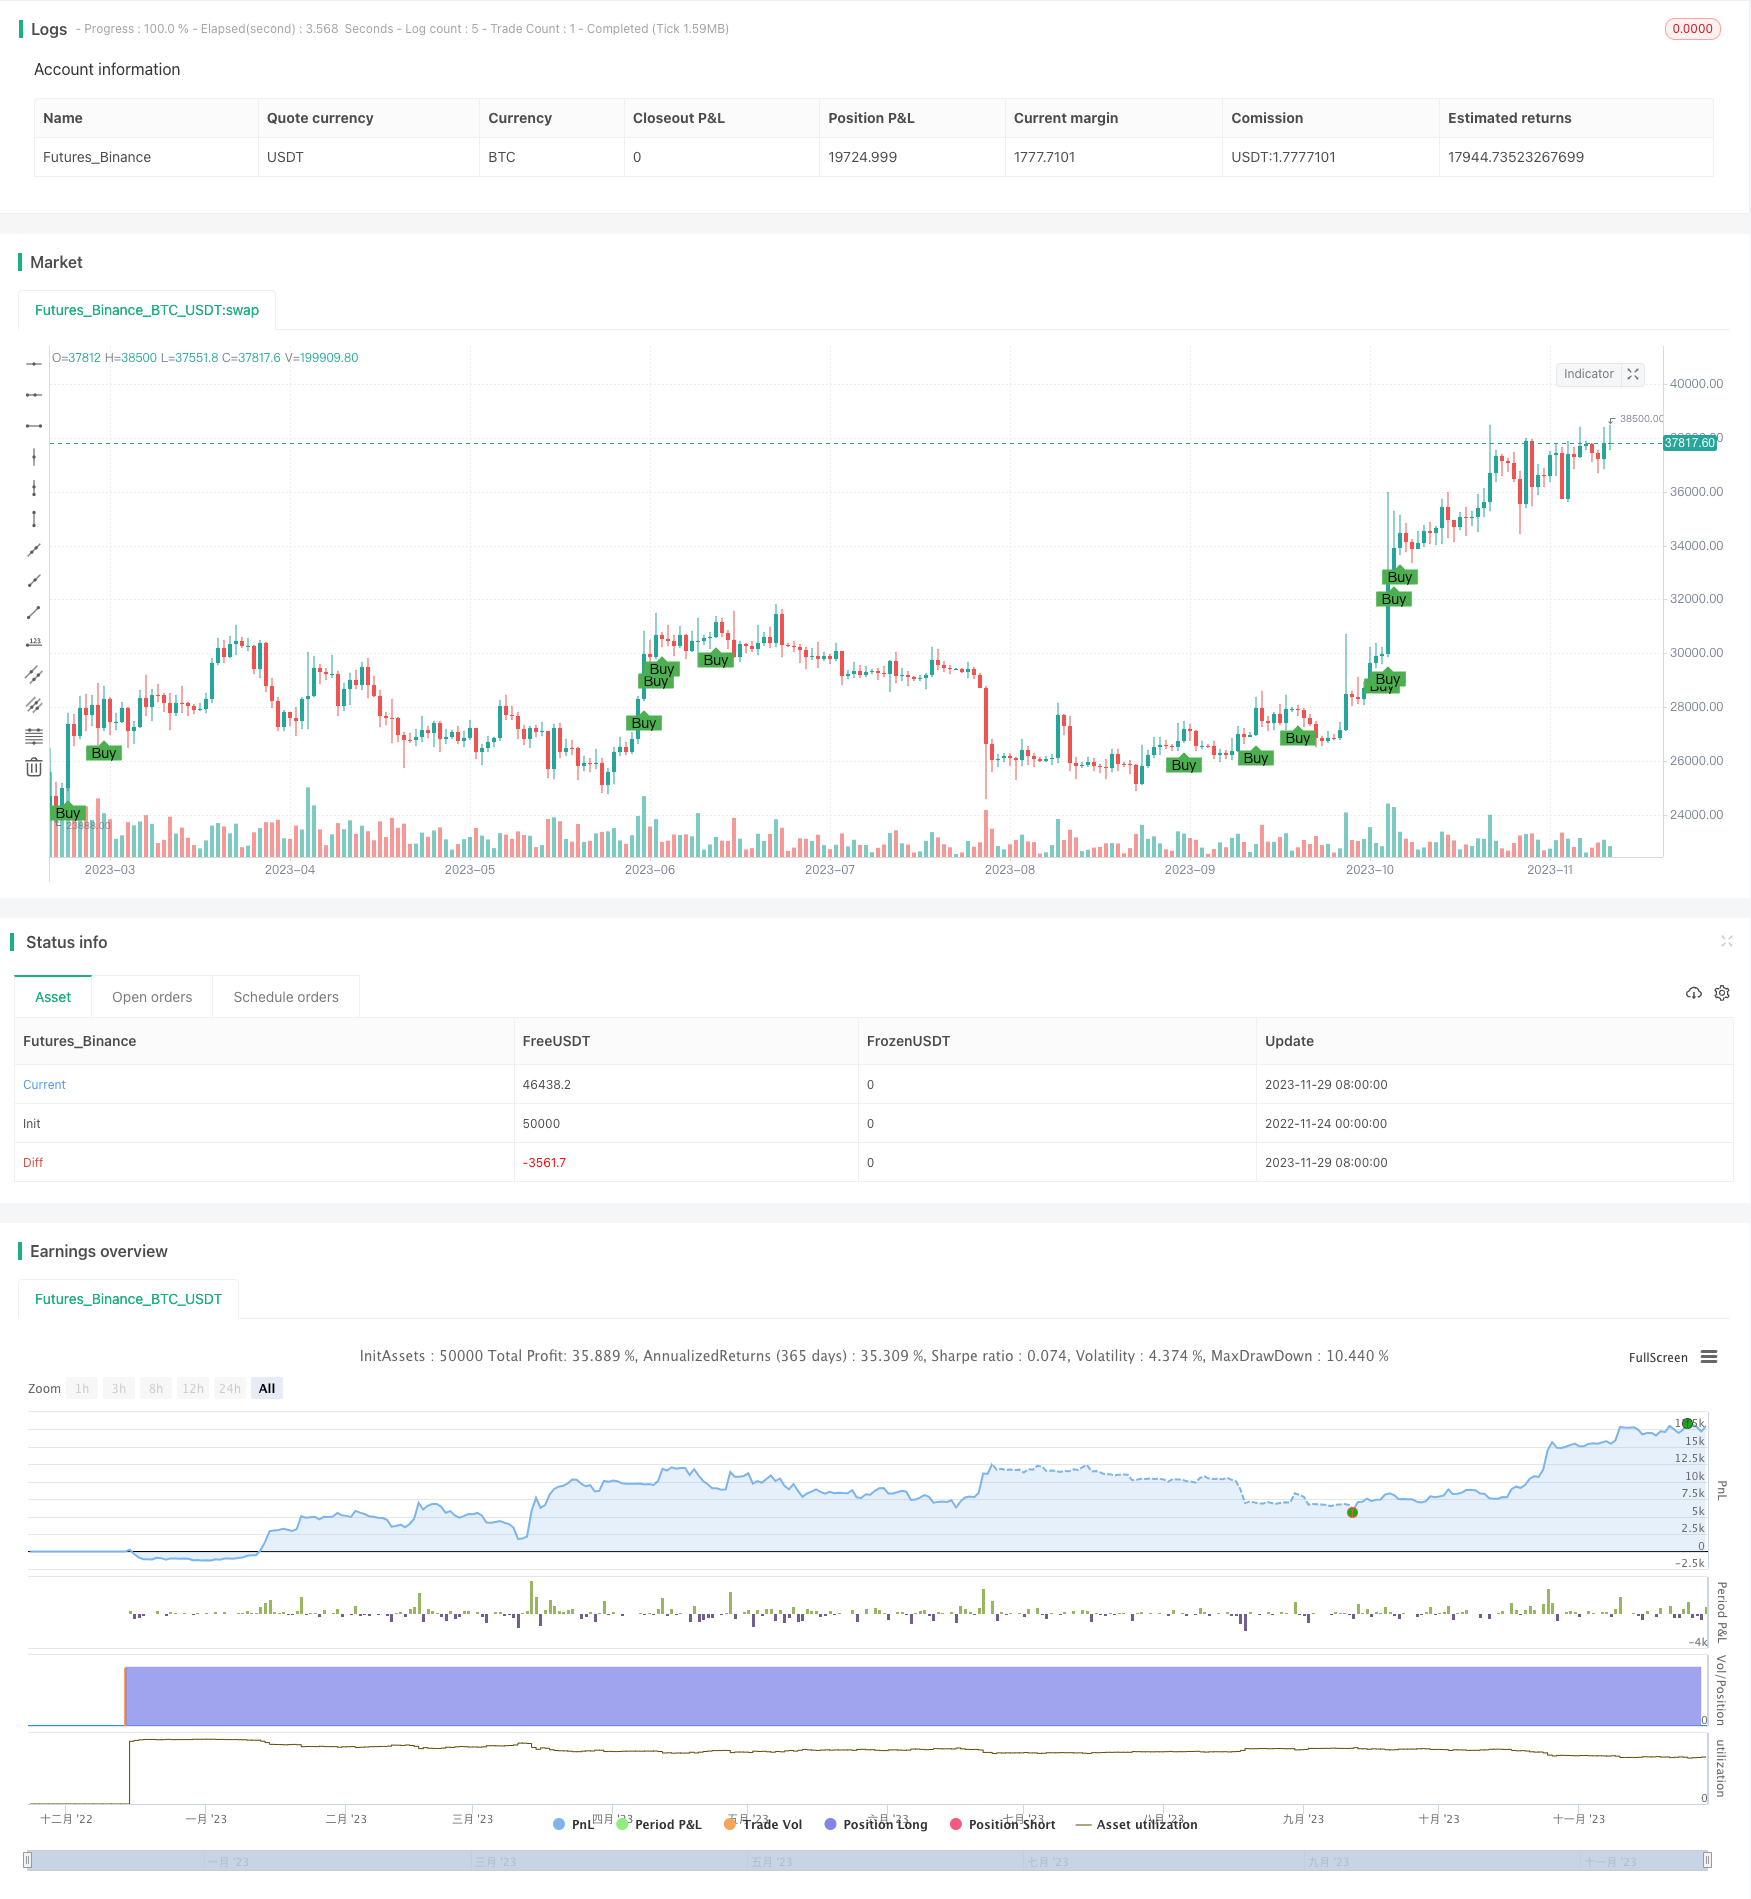
The Monthly Parabolic Breakout Strategy identifies strong buy signals when the RSI hits a 36-month high and one of two MACD signals also reaches a 36-month high. It is ideal for catching once-in-a-lifetime breakouts.
This strategy is mainly based on the RSI and MACD indicators. RSI is used to judge whether a stock is overbought or oversold. MACD is used to discover the momentum and strength of price changes.
Specifically, the strategy first manually calculates the 14-day RSI. Then it calculates MACD1 as the difference between 4-day and 9-day EMAs, and MACD2 as the difference between 12-day and 26-day EMAs.
On this basis, it records the highest values of RSI, MACD1 and MACD2 in the last 36 months. When this month’s RSI exceeds the 36-month high, and either MACD1 or MACD2 also exceeds its 36-month high, a strong buy signal is generated.
This signal combines the new high judgments of RSI and MACD over different time periods. It can effectively identify great buying opportunities in the rare major trends, capturing such chances.
The biggest advantage of this strategy is that it combines the look back periods of multiple indicators for new high judgments across different time periods. This allows it to effectively discover excellent buying opportunities in long-term mega trends. This can greatly increase the probability of profit.
In addition, the strategy directly gives buy signal locations, which can clearly guide trading decisions and is very suitable for quantitative trading.
The biggest risk of this strategy is that it relies too much on the highest values of the indicators over time periods, which may cause bad trades. For example, if the market appears to plunge and then rebound, signals may also be triggered. We then face the risk of missing the opportunity to profit from the rebound.
In addition, the strategy directly sets a stop loss exit after 30 days, which may be too conservative to sustain profits in mega trends.
To reduce risks, we can consider combining other factors to optimize entry and stop loss conditions, such as trading volume breakouts, volatility measurements, etc.
This strategy can be optimized in the following aspects:
Optimize parameters. We can test optimizations of the RSI period, MACD period and other parameters to find the best parameter combinations.
Incorporate other indicators or fundamentals. For example, combine breakouts in trading volume to confirm the trend, or pay attention to important fundamental news events.
Optimize entry and exit mechanisms. We can set more sophisticated take profit and stop loss plans, instead of simply exiting after 30 days. We can also incorporate trend line judgments, channel breakouts, etc.
Evaluate strategy robustness. We can backtest longer historical periods to evaluate parameter stability. We can also conduct multi-market backtests to evaluate adaptability.
The Monthly Parabolic Breakout Strategy successfully identifies excellent buying opportunities in long-term mega trends by combining multi-period RSI and MACD. It incorporates both trend and overbought/oversold judgments, and has extremely strong practical value. With further optimizations, this strategy can become an efficient quantitative trading system. It provides powerful tools for investors to capture market turning points.
/*backtest start: 2022-11-24 00:00:00 end: 2023-11-30 00:00:00 period: 1d basePeriod: 1h exchanges: [{"eid":"Futures_Binance","currency":"BTC_USDT"}] */ //@version=4 strategy("Stringent Strategy for Backtesting", overlay=true) // Initialize RSI variables rsiPeriod = 14 // Manually calculate RSI delta = close - close[1] gain = iff(delta > 0, delta, 0) loss = iff(delta < 0, -delta, 0) avgGain = sma(gain, rsiPeriod) avgLoss = sma(loss, rsiPeriod) rs = avgGain / avgLoss rsiValue = 100 - (100 / (1 + rs)) // Manually calculate MACD1 and MACD2 emaShort1 = ema(close, 4) emaLong1 = ema(close, 9) macd1 = emaShort1 - emaLong1 emaShort2 = ema(close, 12) emaLong2 = ema(close, 26) macd2 = emaShort2 - emaLong2 // Find the highest values in the last 3 years (36 months) highestRsi = highest(rsiValue, 36) highestMacd1 = highest(macd1, 36) highestMacd2 = highest(macd2, 36) // Define buy signal conditions buyCondition = (rsiValue >= highestRsi) and (macd1 >= highestMacd1 or macd2 >= highestMacd2) // Plot the buy signal on the chart plotshape(series=buyCondition, title="Buy Signal", location=location.belowbar, color=color.green, style=shape.labelup, text="Buy") // Backtesting: Entry and Exit if (buyCondition) strategy.entry("Buy", strategy.long) // Exit condition (Example: Exit after 30 bars) strategy.exit("Sell", "Buy", bar_index[30])template: strategy.tpl:40:21: executing "strategy.tpl" at <.api.GetStrategyListByName>: wrong number of args for GetStrategyListByName: want 7 got 6