Double Reversal Tracking Strategy

Overview
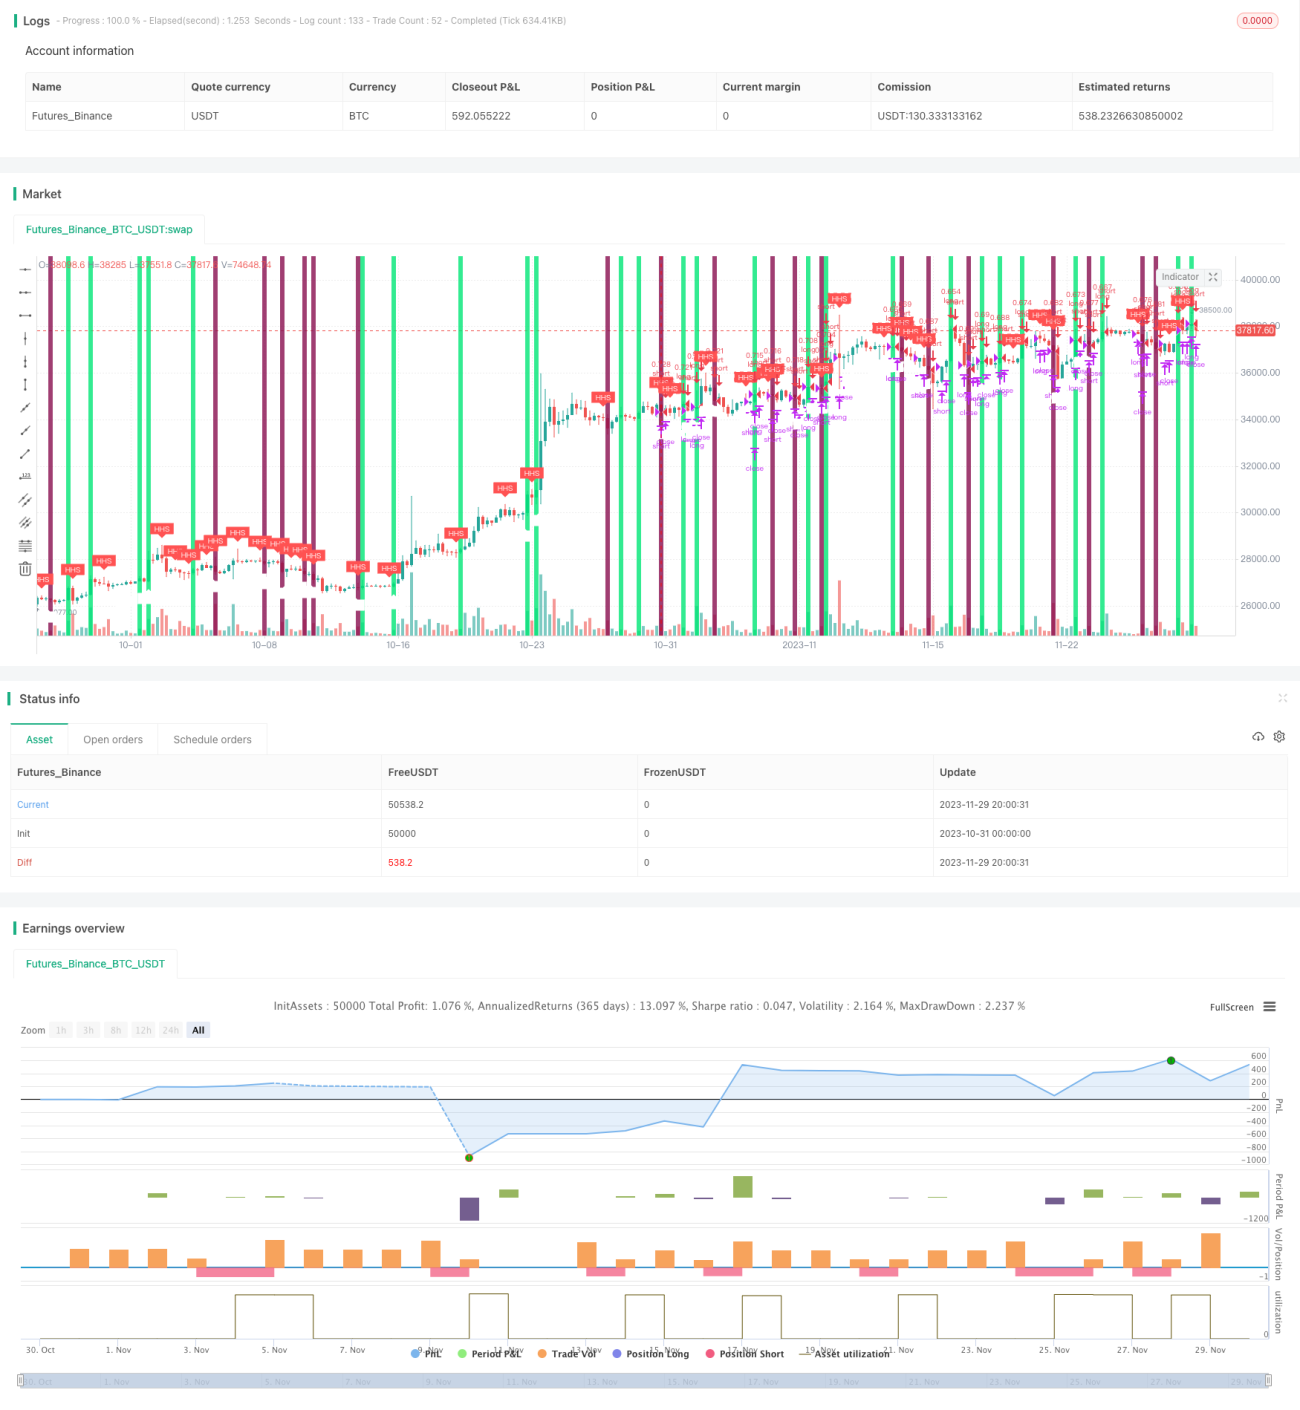
The Double Reversal Tracking strategy generates trading signals by tracking the double reversal points of prices. It will open a short position when the price forms a new high point and will open a long position when the price forms a new low point. This real-time tracking of price reversals can capture changes in market momentum in a timely manner.
Strategy Logic
The Double Reversal Tracking strategy uses two pattern judgments to generate trading signals, including the high buy reversal pattern (HHS) and the low sell reversal pattern (LLB). The judgment formulas are as follows:
- HHS pattern: close[0] < close[1] and high[0] > high[1]
- LLB pattern: close[0] > close[1] and low[0] < low[1]
When the above conditions are met, the bar index and price of HHS and LLB will be recorded respectively. After that, the strategy will monitor in real time whether the price breaks through the recorded reversal price. When the price breaks through the HHS reversal high point, it indicates the price pattern has reversed to a downward trend and the strategy will open a short position. On the contrary, when the price breaks through the LLB reversal low point, it indicates the price pattern has reversed to an upward trend and the strategy will open a long position. In this way, the Double Reversal Tracking strategy can dynamically capture price reversal opportunities.
When the strategy is running, it will also visually display the HHS, LLB patterns and breakout situations through markings and background colors. This is very helpful for intuitively judging market conditions and verifying the strategy. In summary, the Double Reversal Tracking strategy realizes trading by dynamically tracking price reversal points, which can effectively capture price reversal opportunities.
Advantage Analysis
The Double Reversal Tracking strategy has the following advantages:
-
Real-time tracking of price reversals allows quick capturing of market reversal opportunities. Compared with other strategies tracking moving average and other technical indicators, this strategy has more agile responses.
-
It generates trading signals directly from the price reversal features, without too many parameters to optimize. The implementation is simple and straightforward.
-
The markings of patterns and breakouts make the strategy operation visualization possible, making verification of strategy performance very easy.
-
The code base of the strategy is small and easy to understand and customize. It can serve as an introductory quantitative trading strategy for learning.
In summary, although simple, the Double Reversal Tracking strategy can effectively capture price reversals and is worth using as a fast-tracking reversal strategy.
Risk Analysis
The Double Reversal Tracking strategy also has some risks, mainly:
-
The price reversal judgment relies on single-point information, which has higher probability of misjudgments. The misjudgment probability can be reduced by setting a valid tracking threshold after price breakouts.
-
It does not consider the major trend, and may still generate incorrect short signals during major up trends. Trend filtering can be introduced to avoid such risks.
-
There is no stop loss mechanism to control single trade loss. Reasonable stop loss strategies need to be set for live trading to control losses to acceptable levels.
-
Backtest data may have optimization bias, and live performance may underperform backtests. Live verification is crucial.
In general, as a fast-tracking reversal strategy, this strategy has simple implementations but also has some probability of misjudgments. By introducing trend filtering, stop loss and other modules, the risks can be effectively reduced to make it a stable and reliable live trading strategy.
Enhancement Areas
To reduce misjudgment probability and improve stability, the strategy can be enhanced from the following aspects:
-
Add effective breakout validation, such as requiring the price to break the reversal point by some percentage before opening positions.
-
Add major trend judgment module to avoid incorrect short signals during major up trends. Moving average indicators can be used to determine the trend.
-
Implement stop loss strategies like trailing stop loss and zone stop loss to control single trade loss under certain limits.
-
Optimize position sizing algorithms to adjust position size based on market volatility, reducing single position size under high volatility environments.
-
Test longer timeframes of live data to evaluate parameter stability and conduct multi-round optimization iterations.
With adjustments through the above aspects, significant improvements can be achieved on live performance and stability of this strategy.
Conclusion
The Double Reversal Tracking strategy captures reversal opportunities by real-time monitoring of price reversal points. It has simple logic, straightforward execution, and can quickly open positions along reversal trends. But it also has some probability of misjudgments. By introducing trend filtering, stop loss strategies and parameter optimization, the misjudgment risk can be effectively reduced to make it a stable and efficient strategy for live trading. It is especially suitable as a fast-tracking reversal strategy.
/*backtest
start: 2023-10-31 00:00:00
end: 2023-11-30 00:00:00
period: 6h
basePeriod: 15m
exchanges: [{"eid":"Futures_Binance","currency":"BTC_USDT"}]
*/

//@version=4
strategy(title="Rev. FO", shorttitle="Rev. FO", overlay=true, pyramiding=0,calc_on_order_fills=true,calc_on_every_tick=true,default_qty_type=strategy.percent_of_equity,default_qty_value=50,initial_capital=1000,currency="USD",commission_type=strategy.commission.percent,commission_value=0.2,process_orders_on_close=false)

HHS = close[0] < close[1] and high[0] > high[1]- 1