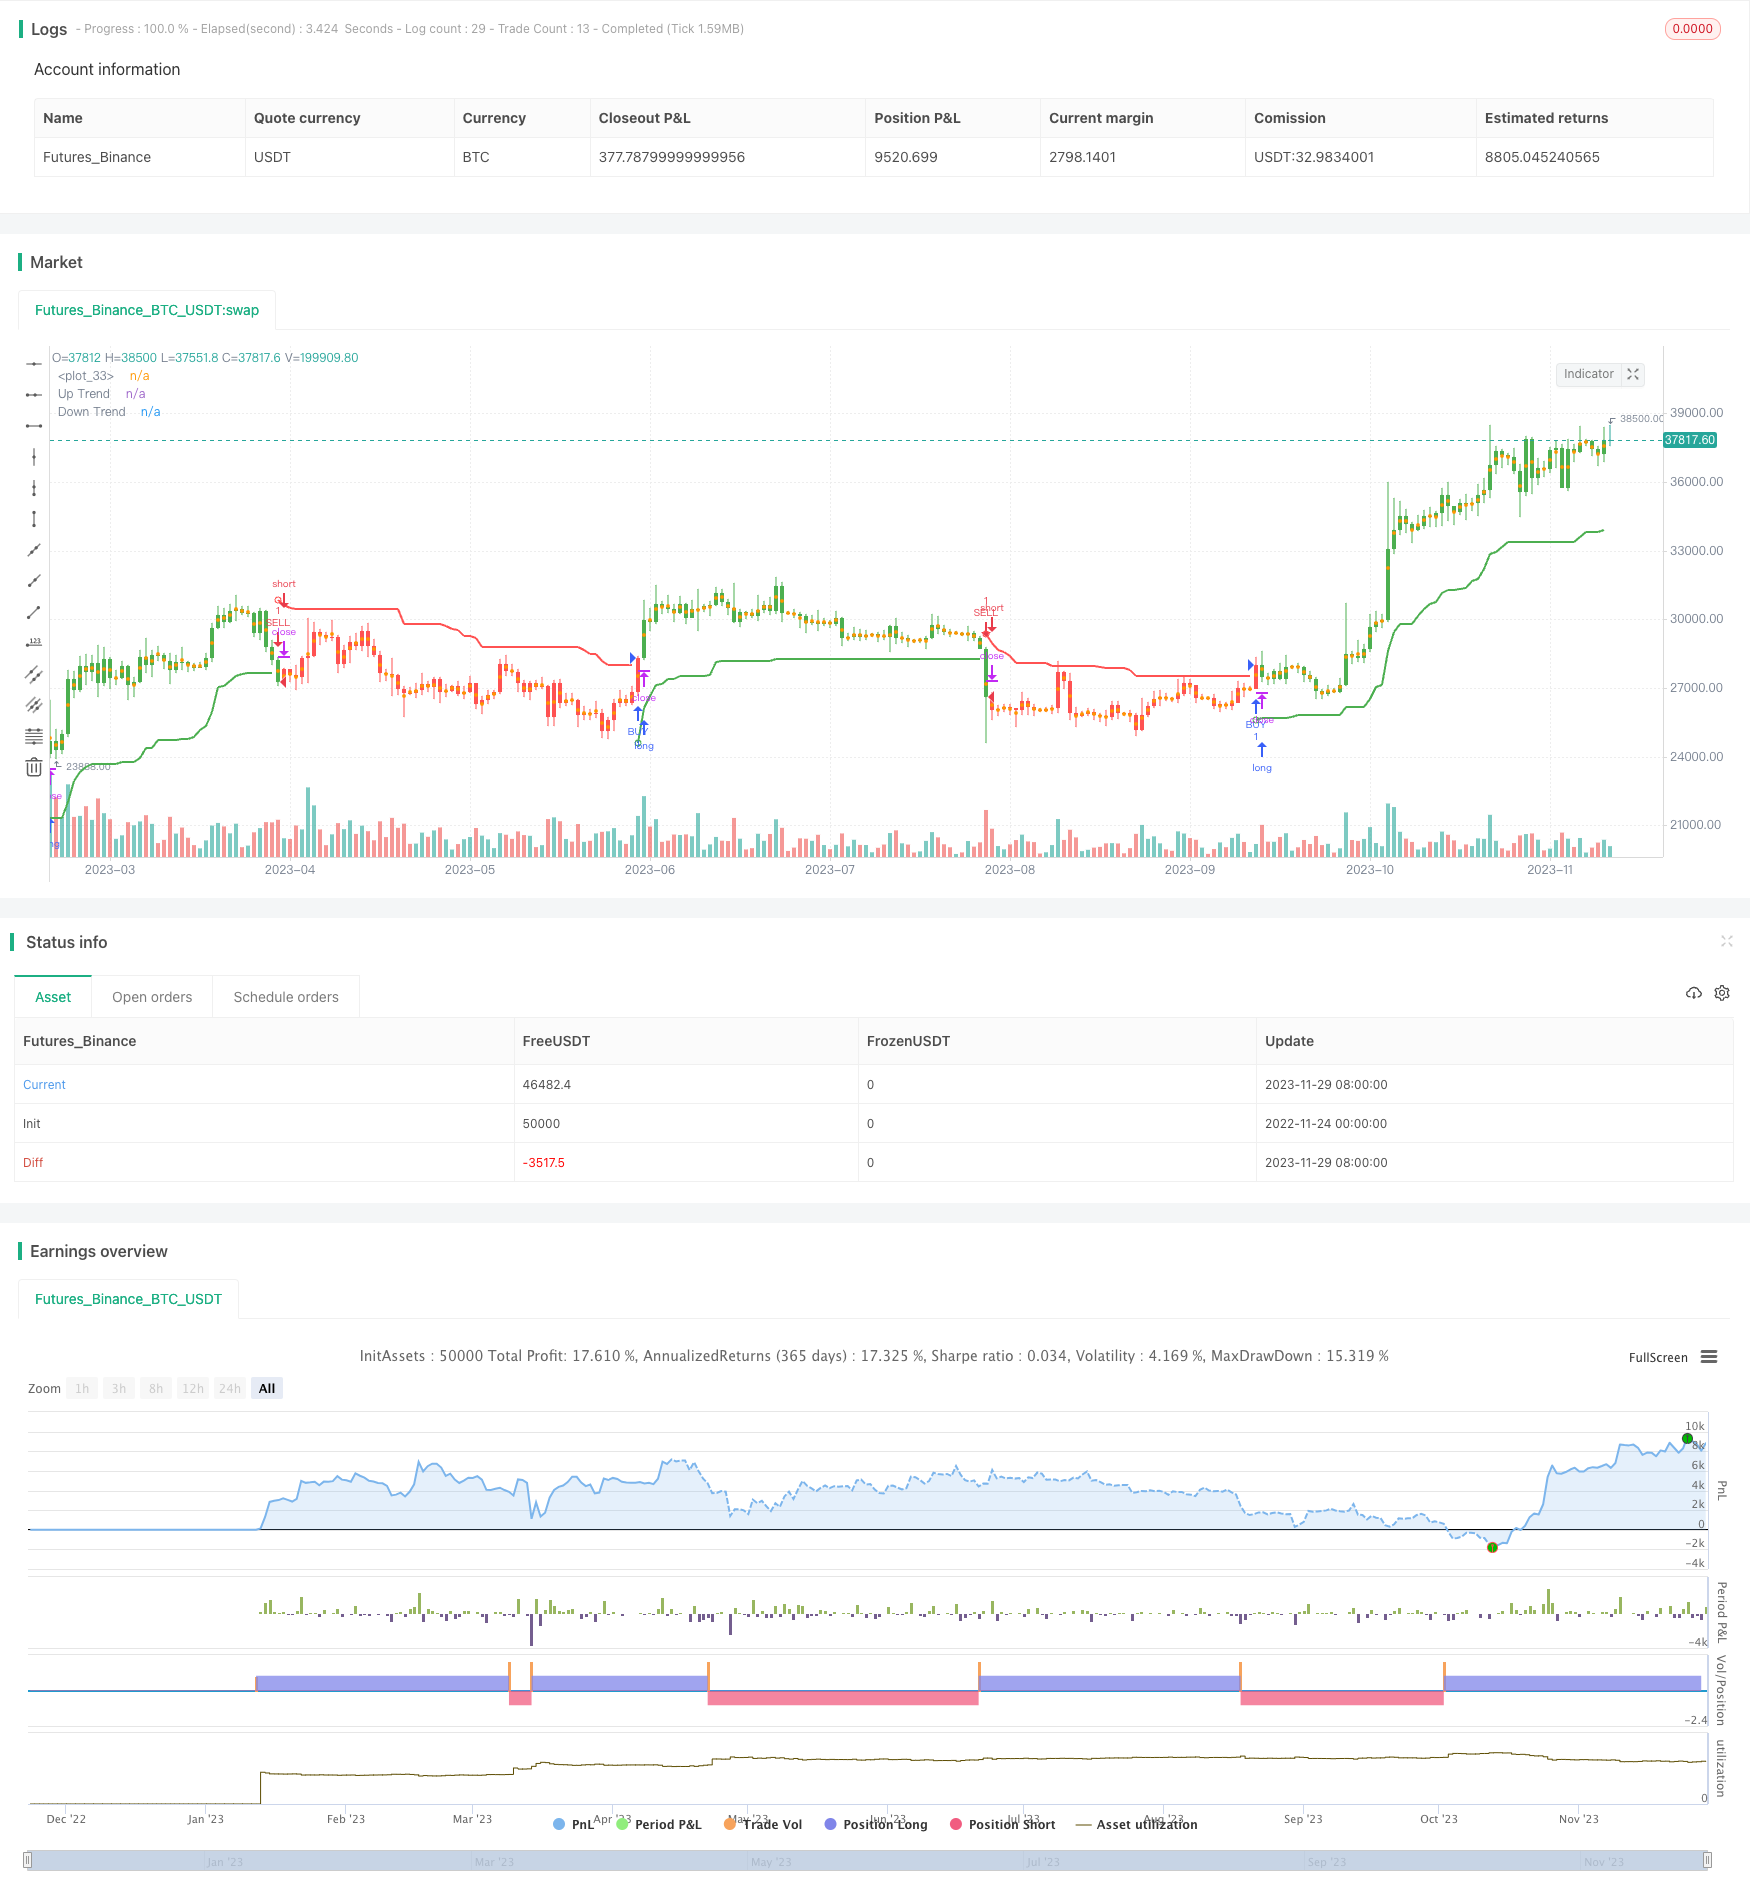
概述
超趋势均线BOLL指标策略是一种常见的基于ATR平均真实波动幅度的追踪止损指标策略。该策略使用超趋势均线指标在图表上绘制多空趋势通道,并结合布林带指标发出买卖信号。
策略原理
该策略使用两个主要参数——周期和乘数,分别默认为10和3,来计算超趋势均线。具体计算公式如下:
上轨线:收盘价 - (乘数 × ATR平均真实波动幅度) 下轨线:收盘价 + (乘数 × ATR平均真实波动幅度)
当收盘价高于上一周期的上轨时,视为多头信号;当收盘价跌破上一周期的下轨时,视为空头信号。
该策略还结合布林带指标,以中轨 为基准线,上下轨分别离中轨两个标准差。当价格从下向上突破中轨时产生买入信号;从上向下跌破中轨时产生卖出信号。
策略优势
- 使用ATA动态计算波动幅度,能快速捕捉市场变化趋势
- 结合布林带指标,使交易信号更可靠
- 可自定义参数,适应不同市场环境
策略风险
- 在震荡行情中容易产生错误信号
- 参数设置不当可能导致交易频繁
- 无法判断趋势转折点,存在一定的滞后性
优化方向
- 优化ATR周期参数,以 filters 减少噪音交易
- 结合其他指标判断支持阻力位,降低获利回吐概率
- 增加资金管理模块,控制单笔损失
总结
超趋势均线BOLL指标策略整合了多种技术指标的优点,使用动态追踪止损机制,能有效跟踪市场趋势。该策略参数可自定义,适应性强,是一种值得推荐的突破追踪策略。但也应注意防范止损失命中及交易频繁的风险,需要进一步优化以适应更加复杂的市场环境。
策略源码
/*backtest
start: 2022-11-24 00:00:00
end: 2023-11-30 00:00:00
period: 1d
basePeriod: 1h
exchanges: [{"eid":"Futures_Binance","currency":"BTC_USDT"}]
*/

// This source code is subject to the terms of the Mozilla Public License 2.0 at https://mozilla.org/MPL/2.0/
// © KivancOzbilgic


//@version=4
strategy("SuperTrend STRATEGY", overlay=true)
Periods = input(title="ATR Period", type=input.integer, defval=10)
src = input(hl2, title="Source")
Multiplier = input(title="ATR Multiplier", type=input.float, step=0.1, defval=3.0)
changeATR= input(title="Change ATR Calculation Method ?", type=input.bool, defval=true)
showsignals = input(title="Show Buy/Sell Signals ?", type=input.bool, defval=false)
highlighting = input(title="Highlighter On/Off ?", type=input.bool, defval=true)
barcoloring = input(title="Bar Coloring On/Off ?", type=input.bool, defval=true)
atr2 = sma(tr, Periods)
atr= changeATR ? atr(Periods) : atr2
up=src-(Multiplier*atr)
up1 = nz(up[1],up)
up := close[1] > up1 ? max(up,up1) : up
dn=src+(Multiplier*atr)
dn1 = nz(dn[1], dn)
dn := close[1] < dn1 ? min(dn, dn1) : dn
trend = 1
trend := nz(trend[1], trend)
trend := trend == -1 and close > dn1 ? 1 : trend == 1 and close < up1 ? -1 : trend
upPlot = plot(trend == 1 ? up : na, title="Up Trend", style=plot.style_linebr, linewidth=2, color=color.green)
buySignal = trend == 1 and trend[1] == -1
plotshape(buySignal ? up : na, title="UpTrend Begins", location=location.absolute, style=shape.circle, size=size.tiny, color=color.green, transp=0)
plotshape(buySignal and showsignals ? up : na, title="Buy", text="Buy", location=location.absolute, style=shape.labelup, size=size.tiny, color=color.green, textcolor=color.white, transp=0)
dnPlot = plot(trend == 1 ? na : dn, title="Down Trend", style=plot.style_linebr, linewidth=2, color=color.red)
sellSignal = trend == -1 and trend[1] == 1
plotshape(sellSignal ? dn : na, title="DownTrend Begins", location=location.absolute, style=shape.circle, size=size.tiny, color=color.red, transp=0)
plotshape(sellSignal and showsignals ? dn : na, title="Sell", text="Sell", location=location.absolute, style=shape.labeldown, size=size.tiny, color=color.red, textcolor=color.white, transp=0)
mPlot = plot(ohlc4, title="", style=plot.style_circles, linewidth=0)
longFillColor = highlighting ? (trend == 1 ? color.green : color.white) : color.white
shortFillColor = highlighting ? (trend == -1 ? color.red : color.white) : color.white
fill(mPlot, upPlot, title="UpTrend Highligter", color=longFillColor)
fill(mPlot, dnPlot, title="DownTrend Highligter", color=shortFillColor)
FromMonth = input(defval = 9, title = "From Month", minval = 1, maxval = 12)
FromDay   = input(defval = 1, title = "From Day", minval = 1, maxval = 31)
FromYear  = input(defval = 2018, title = "From Year", minval = 999)
ToMonth   = input(defval = 1, title = "To Month", minval = 1, maxval = 12)
ToDay     = input(defval = 1, title = "To Day", minval = 1, maxval = 31)
ToYear    = input(defval = 9999, title = "To Year", minval = 999)
start     = timestamp(FromYear, FromMonth, FromDay, 00, 00)
finish    = timestamp(ToYear, ToMonth, ToDay, 23, 59)
window()  => time >= start and time <= finish ? true : false
longCondition = buySignal
if (longCondition)
    strategy.entry("BUY", strategy.long)
shortCondition = sellSignal
if (shortCondition)
    strategy.entry("SELL", strategy.short)
buy1= barssince(buySignal)
sell1 = barssince(sellSignal)
color1 = buy1[1] < sell1[1] ? color.green : buy1[1] > sell1[1] ? color.red : na
barcolor(barcoloring ? color1 : na)