概述
超级趋势交易策略(Supertrend Trading Strategy)是一种基于平均真实范围(ATR)和移动平均线(MA)的趋势跟踪策略。它融合了趋势跟随和突破交易的优点,旨在识别中期趋势方向并根据趋势变化生成交易信号。
该策略的主要思想是,当价格突破超级趋势通道时,表明趋势发生反转,这时进行买入或卖出。它同时设置了止损和止盈水平,以锁定收益和控制风险。
策略原理
超级趋势策略的计算过程分为以下几步:
- 计算ATR。ATR反映了一段时间内的平均波动幅度。
- 根据最高价和最低价计算通道中线。通道中线的计算公式为:(最高价+最低价)/2
- 根据ATR和用户设定的ATR乘数,计算通道上限和下限。通道上限的计算公式为:中线+(ATR×ATR乘数);通道下限的计算公式为:中线-(ATR×ATR乘数)。
- 比较收盘价与通道上下限的关系,判断趋势方向。收盘价高于通道上限为趋势向上,收盘价低于通道下限为趋势向下。
- 当价格突破趋势通道时,进行反向交易。如价格从下向上突破通道上限,产生买入信号;价格从上向下跌破通道下限,产生卖出信号。
该策略的优势在于,它同时结合了趋势跟随与趋势反转的交易方式。它既能判断大趋势方向,又能及时捕捉反转机会。此外,它还设置了止损止盈机制来控制风险。
优势分析
超级趋势策略具有以下优势:
1. 跟踪中期趋势
超级趋势通道基于ATR计算,能够有效反映中期价格波动范围。它比普通移动平均线更能跟踪中期趋势。
2. 及时捕捉趋势反转
价格突破通道时,快速发出交易信号,可以及时捕捉大趋势的反转。这为适当调整头寸,减少超期持有提供了保证。
3. 有止损止盈机制
该策略同时设定了止损位和止盈位,可以自动止损止盈。这在很大程度上减少了泛滥止损的风险,有利于把握趋势行情。
4. 实现方式简单
该策略主要运用均线和ATR指标,实现比较简单,容易掌握。这降低了实盘操作的难度。
5. 资金利用效率高
超级趋势策略追踪中期趋势,并控制单笔滑点,整体资金利用效率较高。
风险分析
超级趋势策略也存在一些潜在风险:
1. 震荡趋势机会成本较高
超级趋势策略侧重跟踪中长期趋势,在震荡整理的市场中,成本较高,可能错过部分做空机会。
2. 参数优化影响效果
ATR周期和ATR乘数的选择会对交易策略的效果产生较大影响。如果参数设置不当,会使交易信号的效果打折扣。
3. 存在一定的滞后性
超级趋势通道计算会存在一定的滞后性,这可能导致信号产生不及时。这是该策略主要需要解决的问题。
4. 需要严格的止损控制
如果止损位置设定过大或风控规避不完善,在极端行情中可能会带来较大亏损。所以必须严格执行止损策略,才能获得稳定收益。
优化方向
该超级趋势策略还具有进一步优化的空间,主要包括:
1. 结合多个ATR周期
可以结合例如10日、20日等多个ATR周期,形成组合ATR指标。这样可以提高指标的灵敏度,改善滞后问题。
2. 增加止损策略模块
此外,通过增加像三重止损、振荡止损、顺序止损等策略模块,可以进一步加强止损控制,从而降低亏损风险。
3. 优化参数设置
优化ATR周期、ATR乘数等参数设置,寻找最优参数组合,可以进一步提升策略收益。此外,参数也可以做动态优化,根据不同品种和行情阶段选择合适的数值。
4. 集成机器学习模型
最后,还可以尝试集成机器学习模型,实现趋势判断和信号产生的自动化。这可以减少主观因素的干扰,有可能进一步提高策略系统的稳定性。
总结
超级趋势交易策略综合运用均线指标和ATR指标判断中期趋势,并在趋势反转点产生交易信号,实现自动止盈止损。该策略捕捉大趋势的同时,也能及时抓住部分反转机会。它的优势主要体现在中期趋势跟踪、趋势反转识别和止损止盈控制三个方面。
但该策略也存在一定的不足,主要是对震荡行情把握不足和滞后的问题。这需要从多方面入手进行优化,比如组合ATR周期、增强止损模块、参数优化以及引入机器学习等方法。这无疑能够进一步增强该超级趋势策略的稳定性和黄金率。
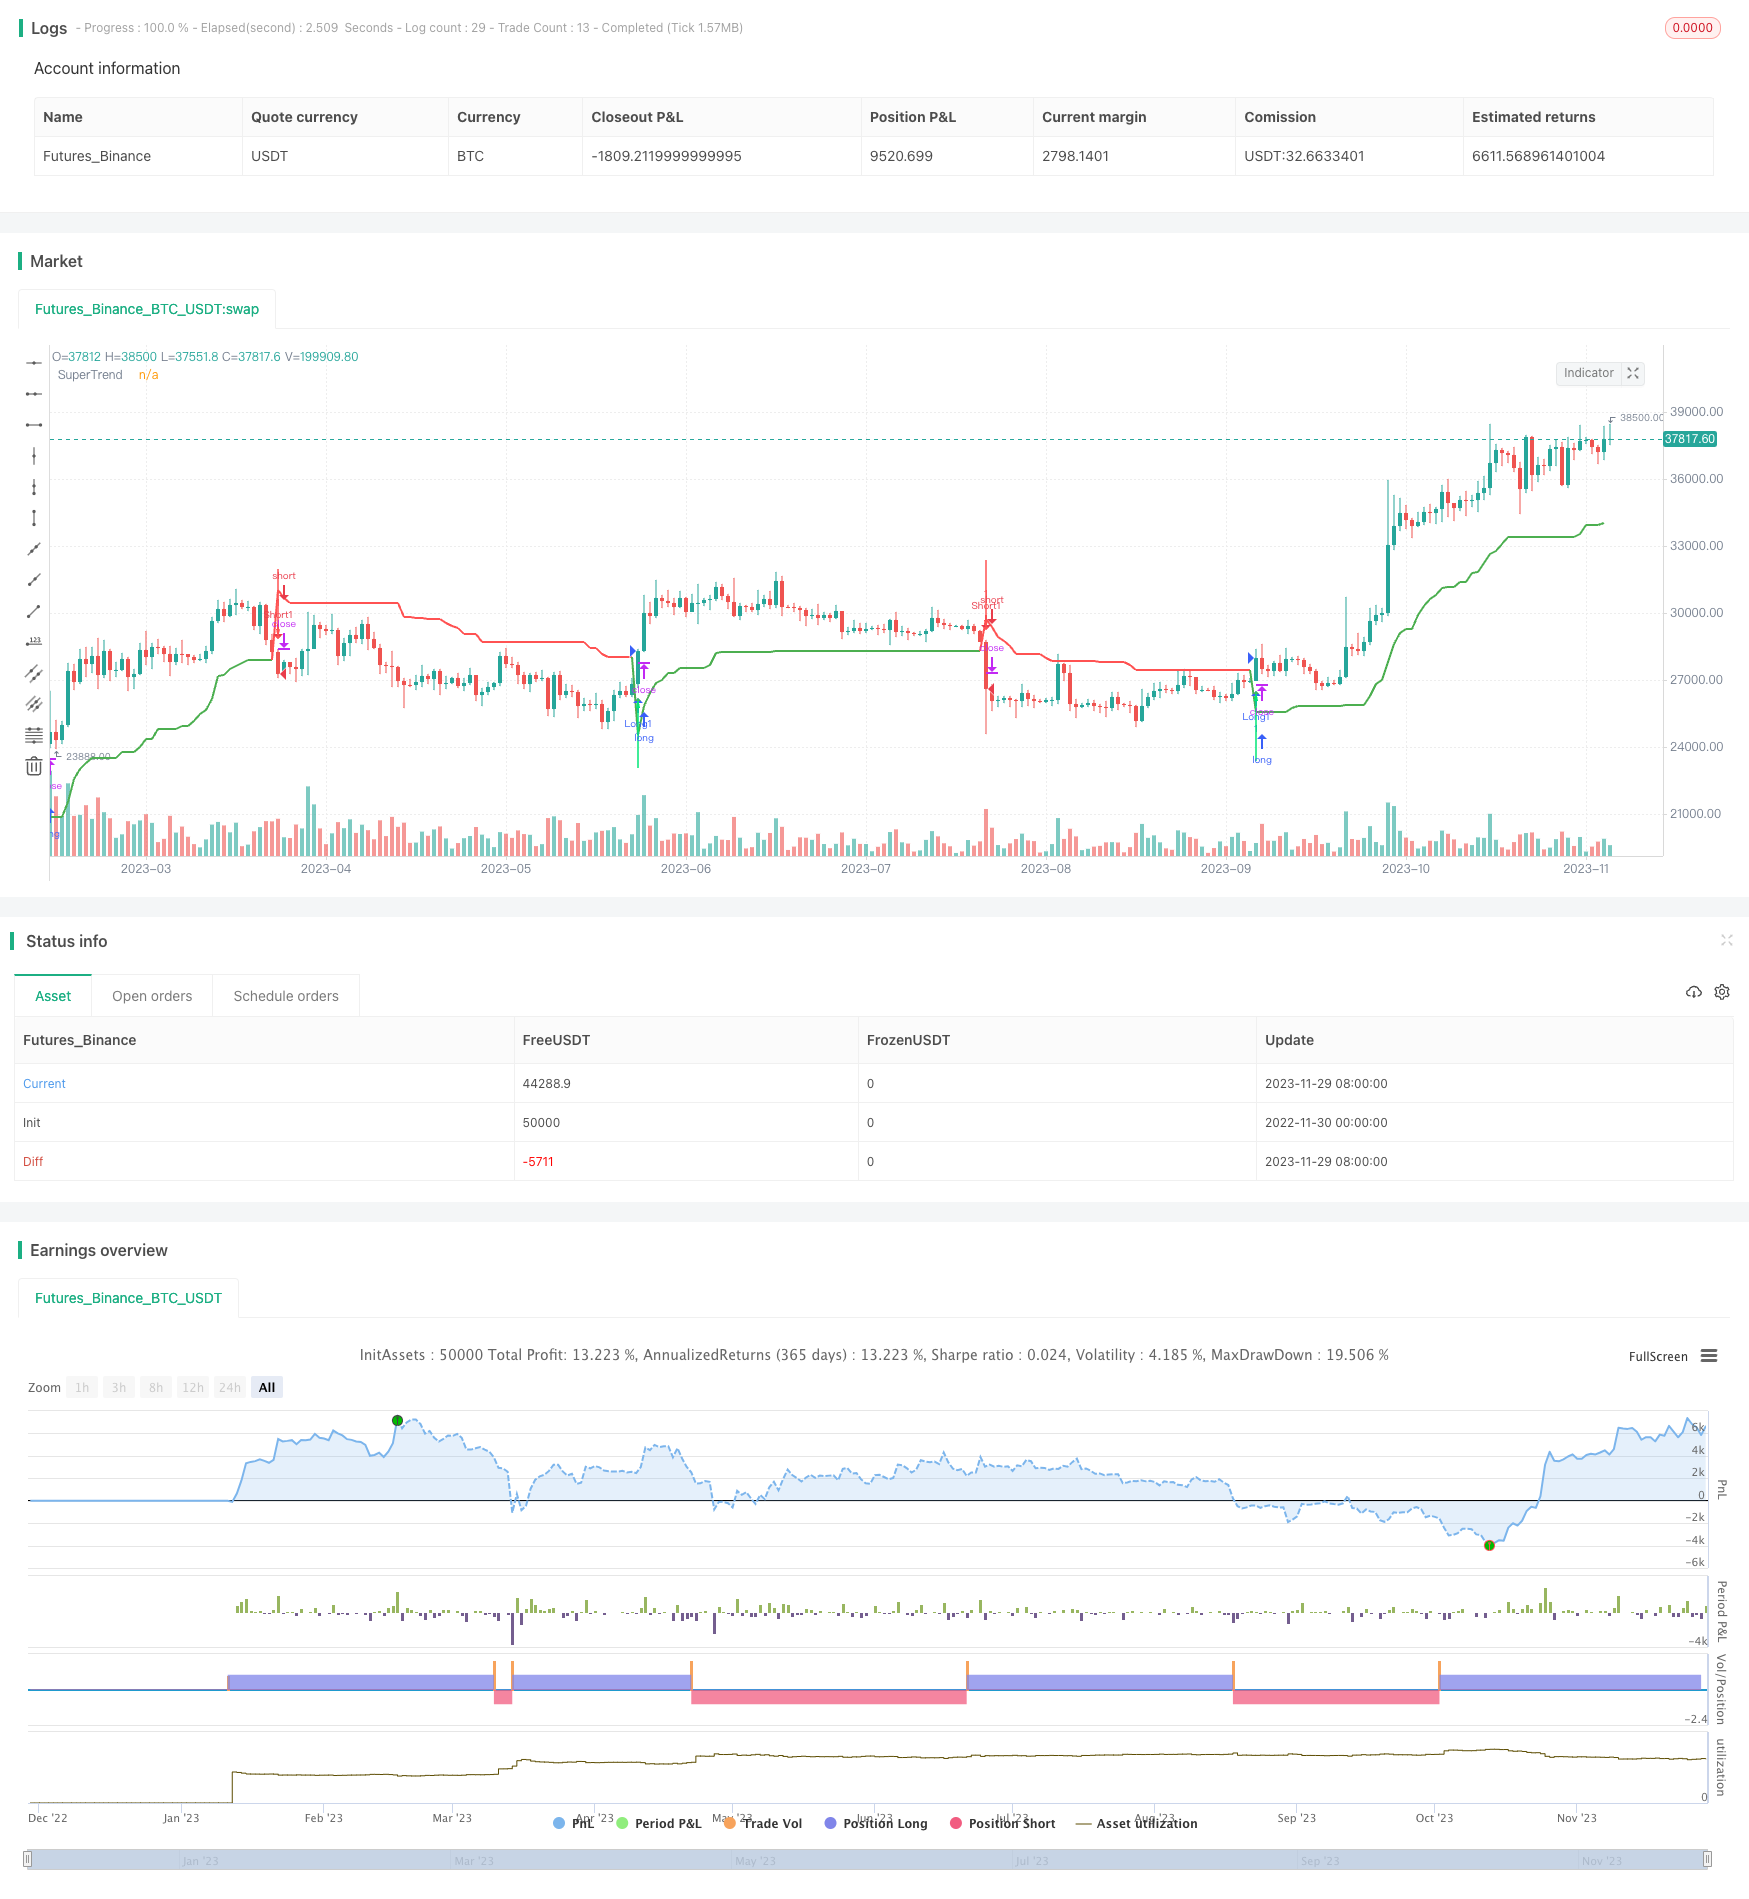
/*backtest
start: 2022-11-30 00:00:00
end: 2023-11-30 00:00:00
period: 1d
basePeriod: 1h
exchanges: [{"eid":"Futures_Binance","currency":"BTC_USDT"}]
*/

//@version=3
strategy("Supertrend V1.0 - Buy or Sell Signal",overlay=true)
Factor=input(3, minval=1,maxval = 100)
Pd=input(7, minval=1,maxval = 100)
//Calculating ATR
atrLength = input(title="ATR Length:",  defval=14, minval=1)
Stop_Loss_Factor = input(1.5, minval=0,step=0.01)
factor_profit = input(1.0, minval=0,step=0.01)

// === INPUT BACKTEST RANGE ===
FromMonth = input(defval = 4, title = "From Month", minval = 1, maxval = 12)
FromDay   = input(defval = 10, title = "From Day", minval = 1, maxval = 31)
FromYear  = input(defval = 2016, title = "From Year", minval = 2009)
ToMonth   = input(defval = 4, title = "To Month", minval = 1, maxval = 12)
ToDay     = input(defval = 10, title = "To Day", minval = 1, maxval = 31)
ToYear    = input(defval = 2039, title = "To Year", minval = 2017)

// === FUNCTION EXAMPLE ===
start     = timestamp(FromYear, FromMonth, FromDay, 00, 00)  // backtest start window
finish    = timestamp(ToYear, ToMonth, ToDay, 23, 59)        // backtest finish window
window()  => time >= start and time <= finish ? true : false // create function "within window of time"


// Calculate ATR
atrValue=atr(atrLength)
decimals = abs(log(syminfo.mintick) / log(10))
Atr = atrValue
if(decimals == 5)
    Atr := atrValue * 10000
if(decimals == 4)
    Atr := atrValue * 1000
if(decimals == 3)
    Atr := atrValue * 100
if(decimals == 2)
    Atr := atrValue * 10


//VJ2 Supertrend

Up=hl2-(Factor*atr(Pd))
Dn=hl2+(Factor*atr(Pd))

TrendUp = 0.0
TrendUp:=close[1]>TrendUp[1]? max(Up,TrendUp[1]) : Up
TrendDown = 0.0
TrendDown:=close[1]<TrendDown[1]? min(Dn,TrendDown[1]) : Dn

Trend = 0.0
Trend := close > TrendDown[1] ? 1: close< TrendUp[1]? -1: nz(Trend[1],1)
Tsl = 0.0
Tsl := Trend==1? TrendUp: TrendDown

linecolor = Trend == 1 ? green : red

plot(Tsl, color = linecolor , style = line , linewidth = 2,title = "SuperTrend")

plotshape(cross(close,Tsl) and close>Tsl , "Up Arrow", shape.triangleup,location.belowbar,green,0,0)
plotshape(cross(Tsl,close) and close<Tsl , "Down Arrow", shape.triangledown , location.abovebar, red,0,0)
//plot(Trend==1 and Trend[1]==-1,color = linecolor, style = circles, linewidth = 3,title="Trend")

plotarrow(Trend == 1 and Trend[1] == -1 ? Trend : na, title="Up Entry Arrow", colorup=lime, maxheight=60, minheight=50, transp=0)
plotarrow(Trend == -1 and Trend[1] == 1 ? Trend : na, title="Down Entry Arrow", colordown=red, maxheight=60, minheight=50, transp=0)


//Strategy
Trend_buy = Trend == 1
Trend_buy_prev = Trend[1] == -1
algo_buy_pre = Trend_buy and Trend_buy_prev
algo_buy = algo_buy_pre == 1 ? 1 : na
Trend_sell= Trend == -1
Trend_sell_prev = Trend[1] == 1
algo_sell_pre = Trend_sell and Trend_sell_prev
algo_sell = algo_sell_pre == 1 ? 1:na

strategy.entry("Long1", strategy.long, when= window() and algo_buy==1)

strategy.entry("Short1", strategy.short, when=window() and algo_sell==1)

bought = strategy.position_size > strategy.position_size
sold = strategy.position_size < strategy.position_size

longStop = Stop_Loss_Factor * valuewhen(bought, Atr, 0)
shortStop = Stop_Loss_Factor * valuewhen(sold, Atr, 0)
longProfit = factor_profit * longStop
shortProfit = factor_profit * shortStop


if(decimals == 5)
    longStop := longStop *100000
    longProfit := longProfit *100000
if(decimals == 4)
    longStop := longStop * 10000
    longProfit := longProfit * 10000
if(decimals == 3)
    longStop := longStop * 1000
    longProfit := longProfit * 1000
if(decimals == 2)
    longStop := longStop * 100
    longProfit := longProfit *100
if(decimals == 5)
    shortStop := shortStop * 100000
    shortProfit := shortProfit * 100000
if(decimals == 4)
    shortStop := shortStop * 10000
    shortProfit := shortProfit * 10000
if(decimals == 3)
    shortStop := shortStop * 1000
    shortProfit := shortProfit * 1000
if(decimals == 2)
    shortStop := shortStop * 100
    shortProfit := shortProfit * 100

strategy.exit("Exit Long", from_entry = "Long1", loss =longStop, profit = longProfit)
strategy.exit("Exit Short", from_entry = "Short1", loss =shortStop, profit = shortProfit)