概述
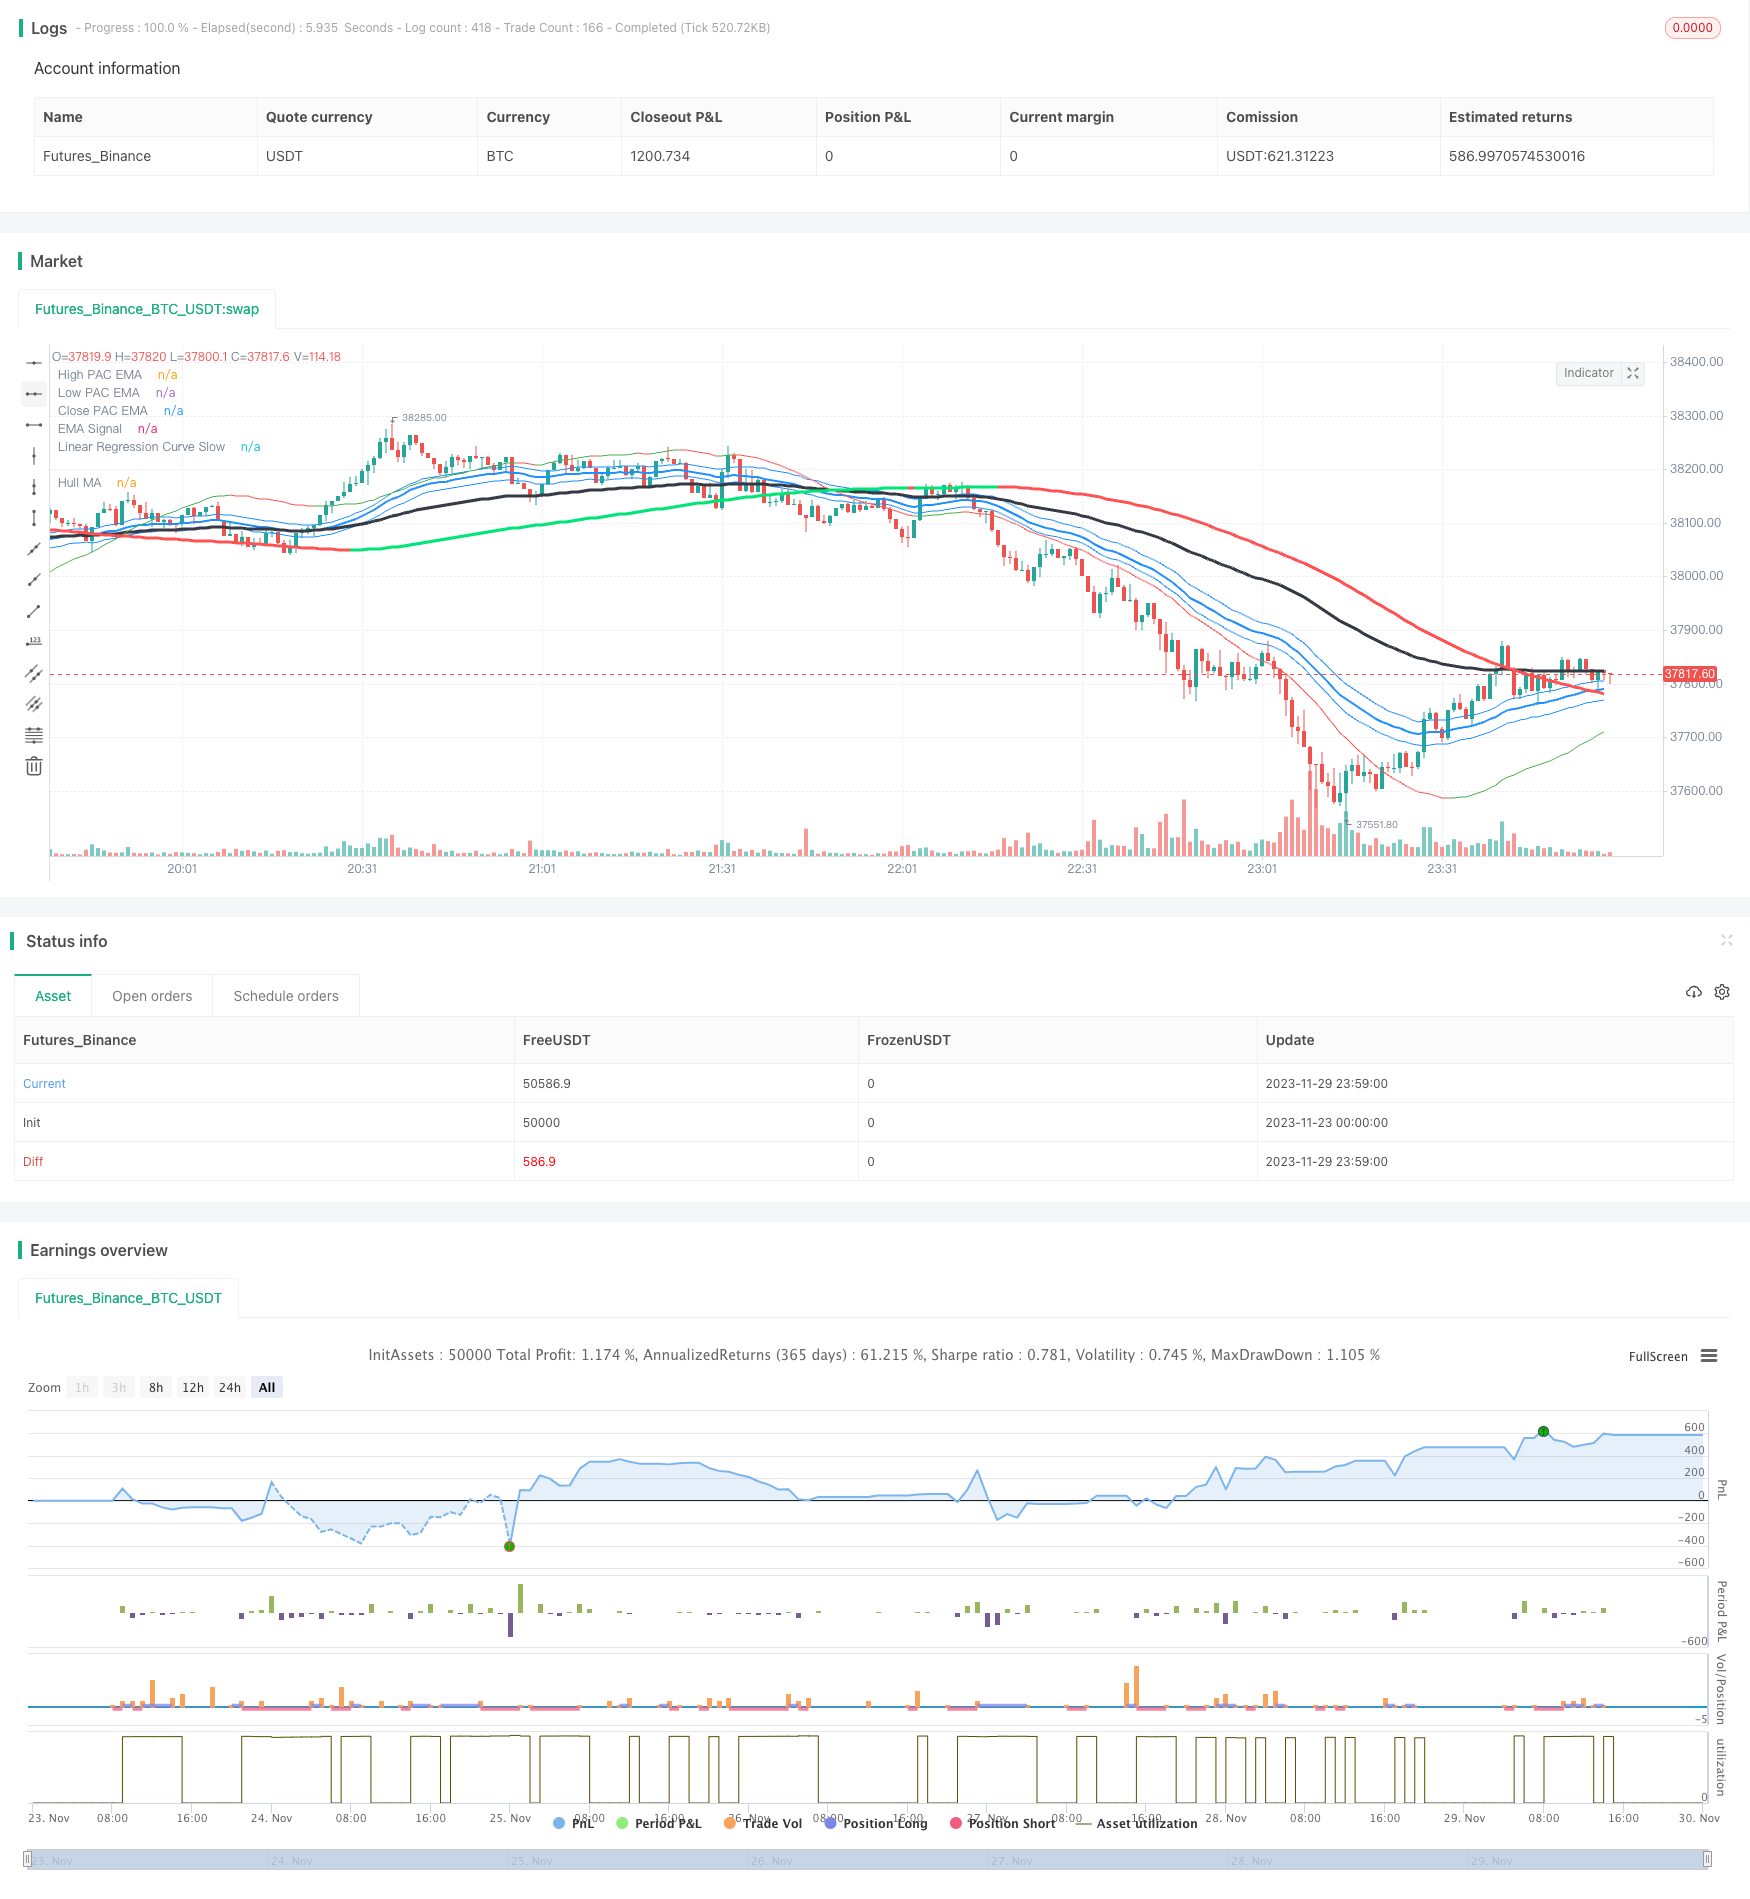
本策略是一个结合Hull MA、价格频道、EMA信号和线性回归的摆荡交易策略。该策略利用Hull MA判断市场趋势方向,价格频道和线性回归判断底部区域,EMA信号判断入市时机,以捕捉中短线趋势。
策略原理
该策略主要由以下几部分指标组成:
- Hull MA
- Hull MA一般参数期间为337,代表中长线趋势方向
- 当2倍18周期WMA高于337周期WMA时为多头市场,反之为空头市场
- 价格频道
- 价格频道由高低价EMA组成,代表容易形成支撑和阻力的区域
- EMA信号
- EMA信号期间一般为89周期,代表短线趋势和入市信号
- 线性回归
- 快线6周期,判断底部和突破
- 慢线89周期,判断中长线趋势方向
入场逻辑:
多头入场:Hull MA向上且价格高于上轨,线性回归向上穿越短期EMA 空头入场:Hull MA向下且价格低于下轨,线性回归向下穿越短期EMA
出场逻辑:
多头出场:价格低于下轨且穿越线性回归向下 空头出场:价格高于上轨且穿越线性回归向上
优势分析
该策略具有以下优势:
- 多指标组合,判断更准确
- Hull MA判断主趋势,频道判断支撑压力,EMA判断入场时机
- 摆荡交易,捕捉中短线趋势
- 策略为反转为主的摆荡交易策略,能捕捉每个中短线周期的趋势
- 风险可控,回撤较小
- 策略只在高概率区域发出信号,避免追高杀跌
风险分析
该策略也存在一定的风险:
- 参数优化空间有限
- 主要参数如EMA周期较为固定,优化空间小
- 震荡行情中可能亏损
- 价格横盘震荡时,止损可能被触发
- 需要一定的技术分析基础
- 策略思路需要一定的价格行为和指标知识,不适合所有人
可以从以下几点进行优化:
- 调整止损策略,例如余震止损
- 优化进场离场逻辑
- 增加其他指标过滤,例如MACD
总结
本策略综合运用Hull MA、价格频道、EMA和线性回归等多个指标,形成一个较为完整的中短线摆荡交易策略。相比单一指标,该策略可以大大提高判断准确性,在趋势和反转中捕捉利润。但也存在一定风险,需要技术分析基础。通过参数调整和进场离场逻辑优化,可以进一步提高策略稳定性。
策略源码
/*backtest
start: 2023-11-23 00:00:00
end: 2023-11-30 00:00:00
period: 1m
basePeriod: 1m
exchanges: [{"eid":"Futures_Binance","currency":"BTC_USDT"}]
*/

//@version=2
strategy("Swing Hull/SonicR/EMA/Linear Regression Strategy", overlay=true)
//Hull MA
n=input(title="HullMA Period",defval=377)
//
n2ma=2*wma(close,round(n/2))
nma=wma(close,n)
diff=n2ma-nma
sqn=round(sqrt(n))
//
n2ma1=2*wma(close[1],round(n/2))
nma1=wma(close[1],n)
diff1=n2ma1-nma1
sqn1=round(sqrt(n))
//
n1=wma(diff,sqn)
n2=wma(diff1,sqn)
condDown = n2 >= n1
condUp = condDown != true
col =condUp ? lime : condDown ? red : yellow
plot(n1,title="Hull MA", color=col,linewidth=3)
// SonicR + Line reg
EMA = input(defval=89, title="EMA Signal")
HiLoLen     = input(34, minval=2,title="High Low channel Length")
lr     = input(89, minval=2,title="Linear Regression Length")
pacC        = ema(close,HiLoLen)
pacL        = ema(low,HiLoLen)
pacH        = ema(high,HiLoLen)
DODGERBLUE = #1E90FFFF
// Plot the Price Action Channel (PAC) base on EMA high,low and close//
L=plot(pacL, color=DODGERBLUE, linewidth=1, title="High PAC EMA",transp=90)
H=plot(pacH, color=DODGERBLUE, linewidth=1, title="Low PAC EMA",transp=90)
C=plot(pacC, color=DODGERBLUE, linewidth=2, title="Close PAC EMA",transp=80)
//Moving Average//
signalMA =ema(close,EMA)
plot(signalMA,title="EMA Signal",color=black,linewidth=3,style=line)
linereg = linreg(close, lr, 0)
lineregf = linreg(close, HiLoLen, 0)
cline=linereg>linereg[1]?green:red
cline2= lineregf>lineregf[1]?green:red
plot(linereg, color = cline, title = "Linear Regression Curve Slow", style = line, linewidth = 1)
//plot(lineregf, color = cline2, title = "Linear Regression Curve Fast", style = line, linewidth = 1)
longCondition = n1>n2
shortCondition = longCondition != true
closeLong =  lineregf-pacH>(pacH-pacL)*2 and close<lineregf and linereg>signalMA
closeShort = pacL-lineregf>(pacH-pacL)*2 and close>lineregf and linereg<signalMA
if shortCondition
    if (close[0] < signalMA[0] and close[1] > pacL[1] and linereg>pacL and close<n1 and pacL<n1) //cross entry
        strategy.entry("SHORT", strategy.short, comment="Short")
strategy.close("SHORT", when=closeShort) //output logic
if longCondition // swing condition
    if (close[0] > signalMA[0] and close[1] < pacH[1] and linereg<pacH and close>n1 and pacH>n1) //cross entry
        strategy.entry("LONG", strategy.long, comment="Long")
strategy.close("LONG", when=closeLong) //output logic