Multi Take Profit and Stop Loss WaveTrend Trend Following Strategy

Overview
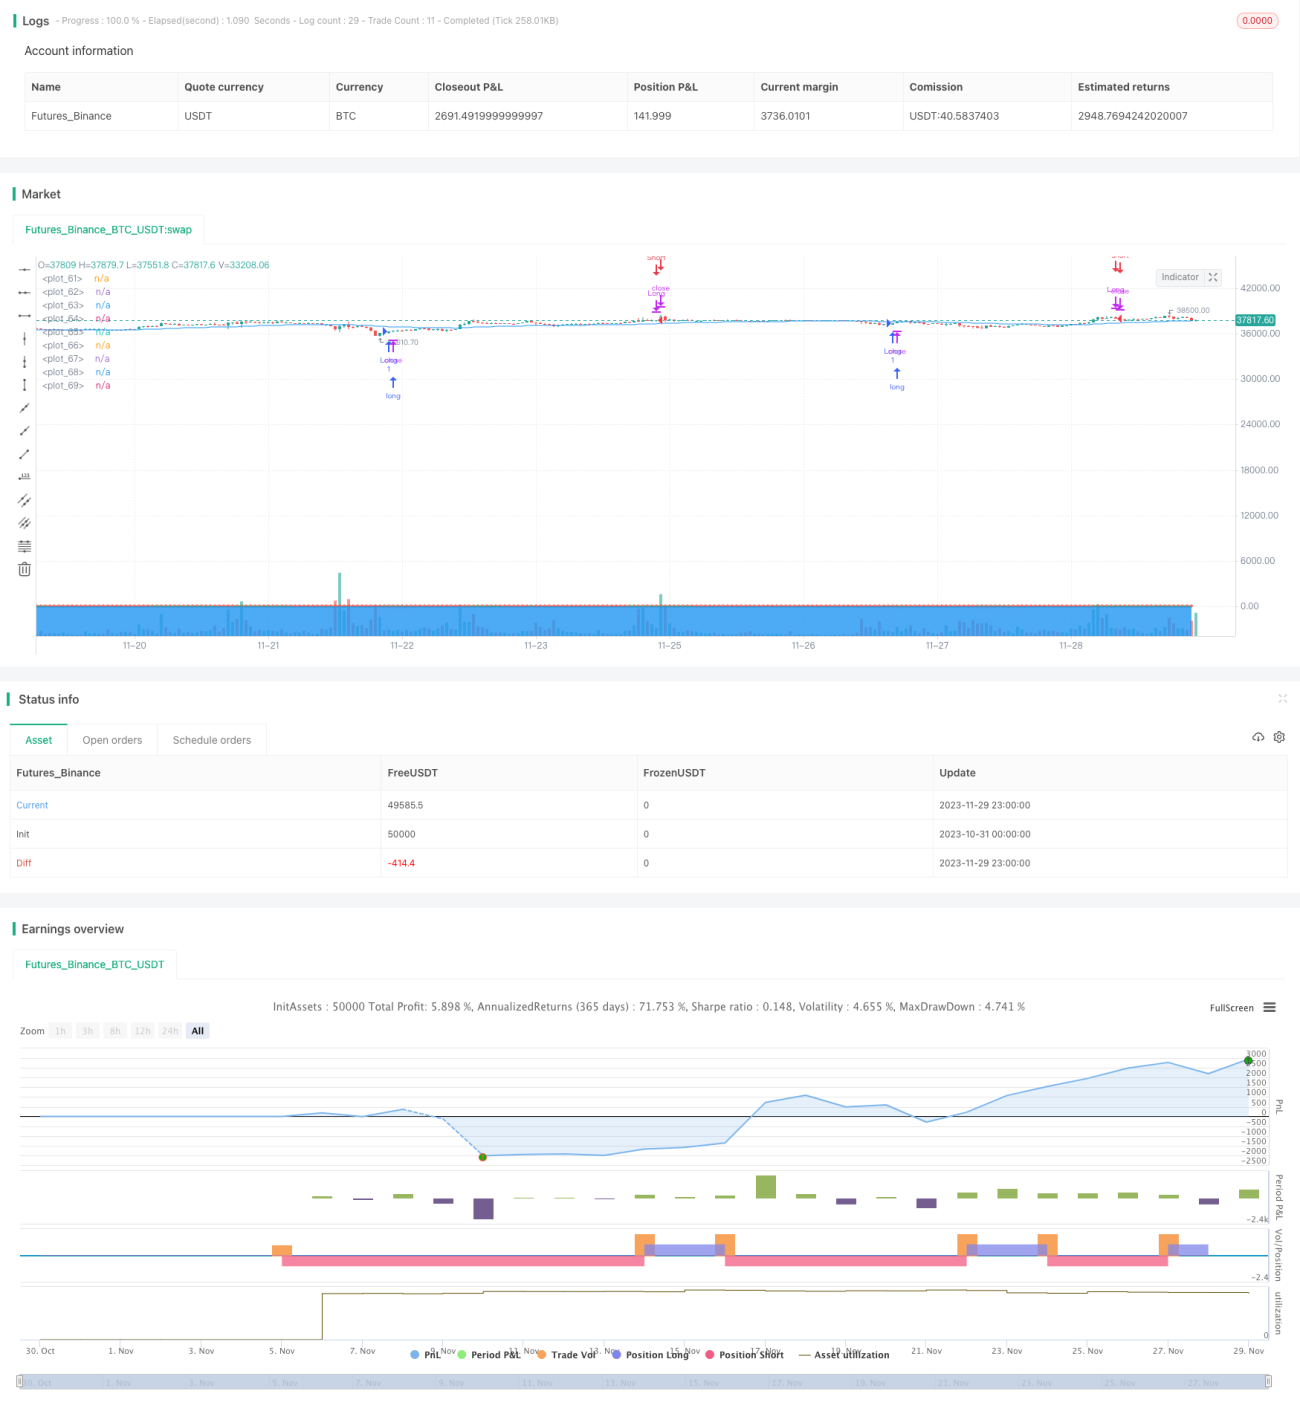
This strategy is based on the original WaveTrend strategy from LazyBear, with additional features like secondary stop loss, multiple take profit levels and high timeframe EMA filter. It uses WaveTrend indicator to generate trading signals, combined with EMA filter and stop loss/take profit management for automated trend following trading.
Strategy Logic
The core indicator of this strategy is WaveTrend, consisting of three components:
-
AP: Average Price = (Highest + Lowest + Close) / 3
-
ESA: n1-period EMA of AP
-
CI: (AP - ESA) / (0.015 * n1-period EMA of absolute value of (AP - ESA))
-
TCI: n2-period EMA of CI, also called WaveTrend Line 1 (WT1)
-
WT2: 4-period SMA of WT1
A long position is opened when WT1 crosses above WT2 (golden cross), and is closed when WT1 crosses below WT2 (death cross).
Additionally, a high timeframe EMA filter is implemented to avoid false signals, so that long trades are only taken when price is above EMA and short trades below EMA.
Advantages
-
Automatically follow trends using WaveTrend without manual judgment
-
Secondary stop loss effectively limits single trade loss
-
Multiple take profit levels maximize profit capture
-
EMA filter improves win rate by avoiding false signals
Risks and Improvements
-
Fails to detect trend reversal, might cause losses
-
Poor parameter tuning leads to over-trading
-
Different parameter sets can be tested for optimization
-
Consider additional indicators for reversal detection
Conclusion
This strategy comprehensively incorporates trend following, risk control and profit maximization through WaveTrend's automatic trend detection, EMA filter to improve efficiency and stop loss/take profit management to balance trend trading and risk control. It is an efficient and steady trend following system. Further parameter optimization and reversal mechanisms can enhance the strategy's applicability.
- 1