Momentum Exponential Moving Average Crossover Trading Strategy

Overview
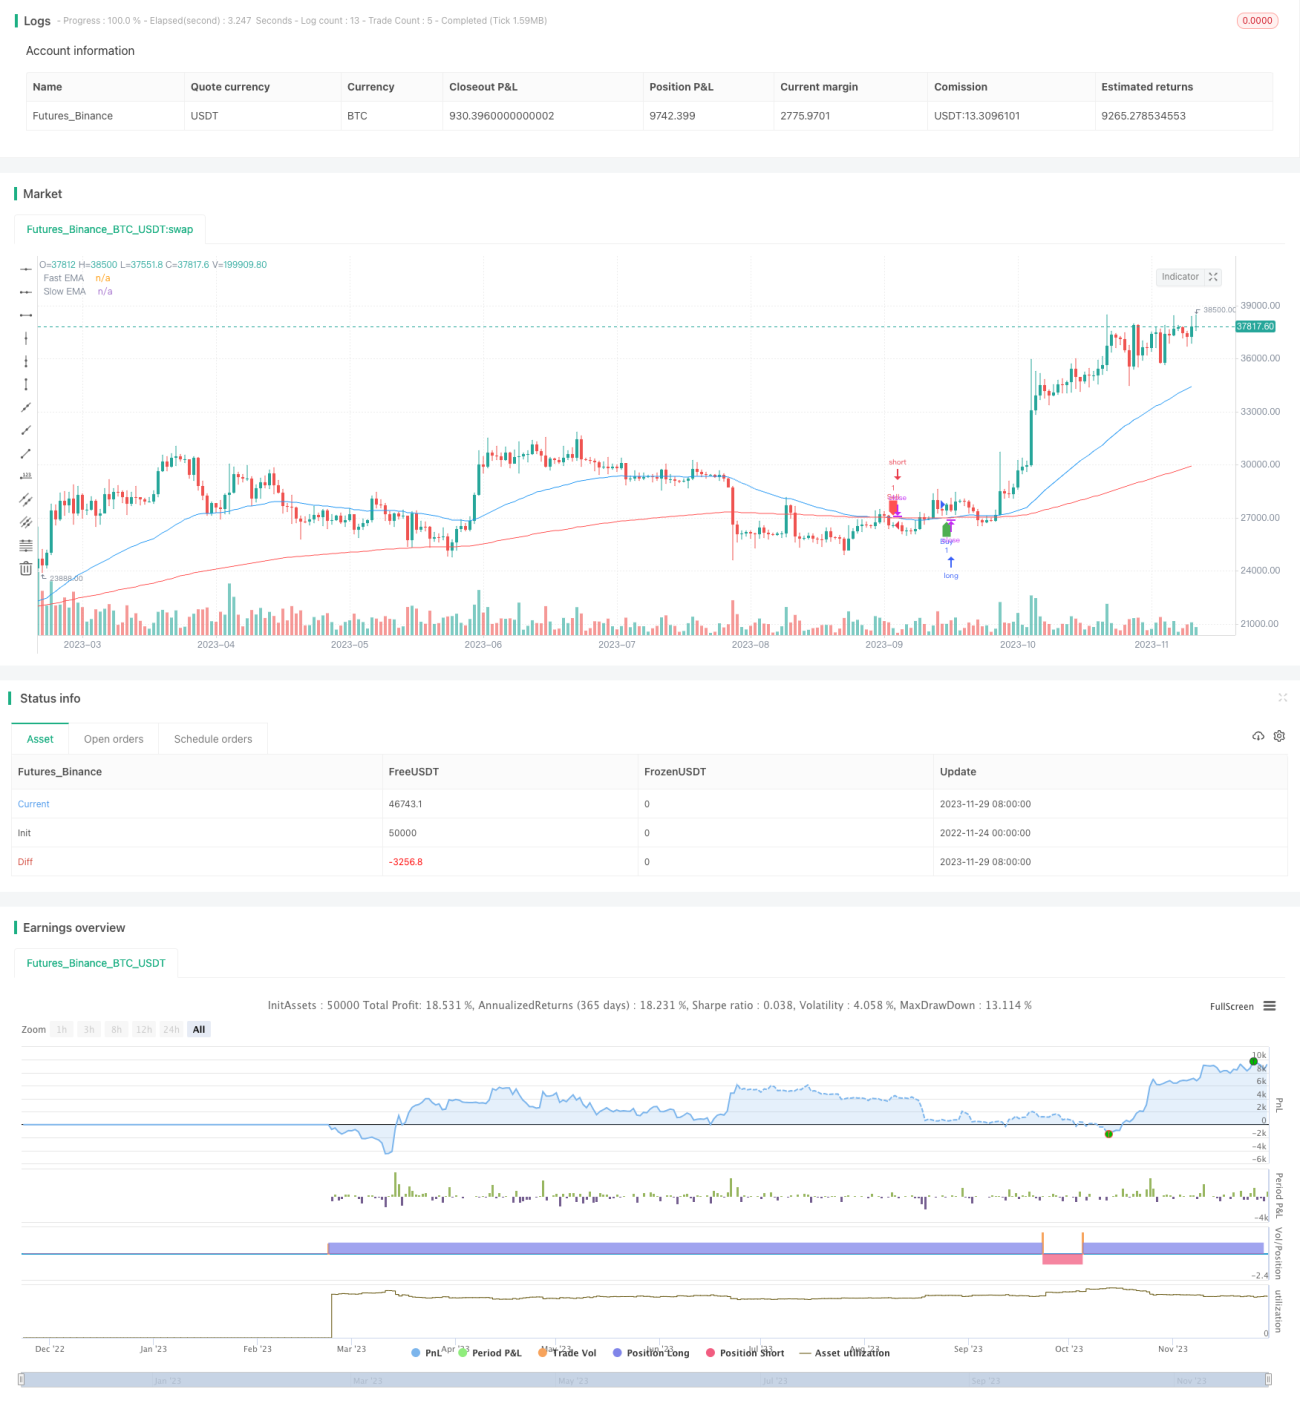
This strategy generates trading signals based on the crossover and crossunder between two Exponential Moving Averages (EMAs), specifically the 50-period EMA and 200-period EMA. It aims to capture changes in short-term and long-term price trends to form a momentum-based trading strategy.
Strategy Logic
-
Calculate two EMAs: 50-period EMA and 200-period EMA. EMAs give more weight to recent data and are more responsive to short-term price moves.
-
Determine trading signals:
- Buy signal: 50-period EMA crosses above 200-period EMA, indicating the short-term trend is turning upwards.
- Sell signal: 50-period EMA crosses below 200-period EMA, indicating the short-term trend is turning downwards.
-
Execute trades based on signals: Go long on buy signals, go short on sell signals.
-
Plot EMAs and trading signals on chart for intuitive visualization.
Advantages
The strategy has the following key advantages:
-
Captures major trend reversals, works well for trending and ranging markets.
-
Simple and clear decision rules, easy to implement and backtest.
-
EMAs smooth price data, help identify signals and filter out noise.
-
Customizable EMA periods suit different holding horizons.
-
Can combine other indicators to further filter signals and optimize.
Risks Analysis
There are also some risks to consider:
-
More false signals and excessive trades possible in choppy markets.
-
Relies solely on single indicator rules, robustness could improve.
-
No stop loss in place, risks uncontrolled losing trades.
-
EMA lag may miss best entry and exit points.
-
Requires backtesting to find optimal parameters, live results may differ.
Corresponding risk control and optimizations include using other indicators as filters, implementing stop losses, introducing machine learning models etc.
Optimization Opportunities
Some ways the strategy can be further optimized:
-
Add other indicators (e.g. MACD, RSI) for a multi-factor model. Improves robustness.
-
Incorporate stop losses. E.g. fixed percentage, trailing stop loss. Limits maximum loss per trade.
-
Utilize machine learning for optimal parameters and enhance signal generation rules.
-
Backtest to find best performing EMA combinations for market regime. Dynamically adjust periods.
-
Evaluate transaction costs. Add slippage, commission to fine tune position sizing.
Conclusion
This is an overall simple, classic breakout strategy based on EMA crossovers. Has merits but also some inherent flaws and room for improvement. Enhancing signal reliability, risk control, dynamic adjustment etc. will greatly improve its profitability in live trading.
- 1