概述
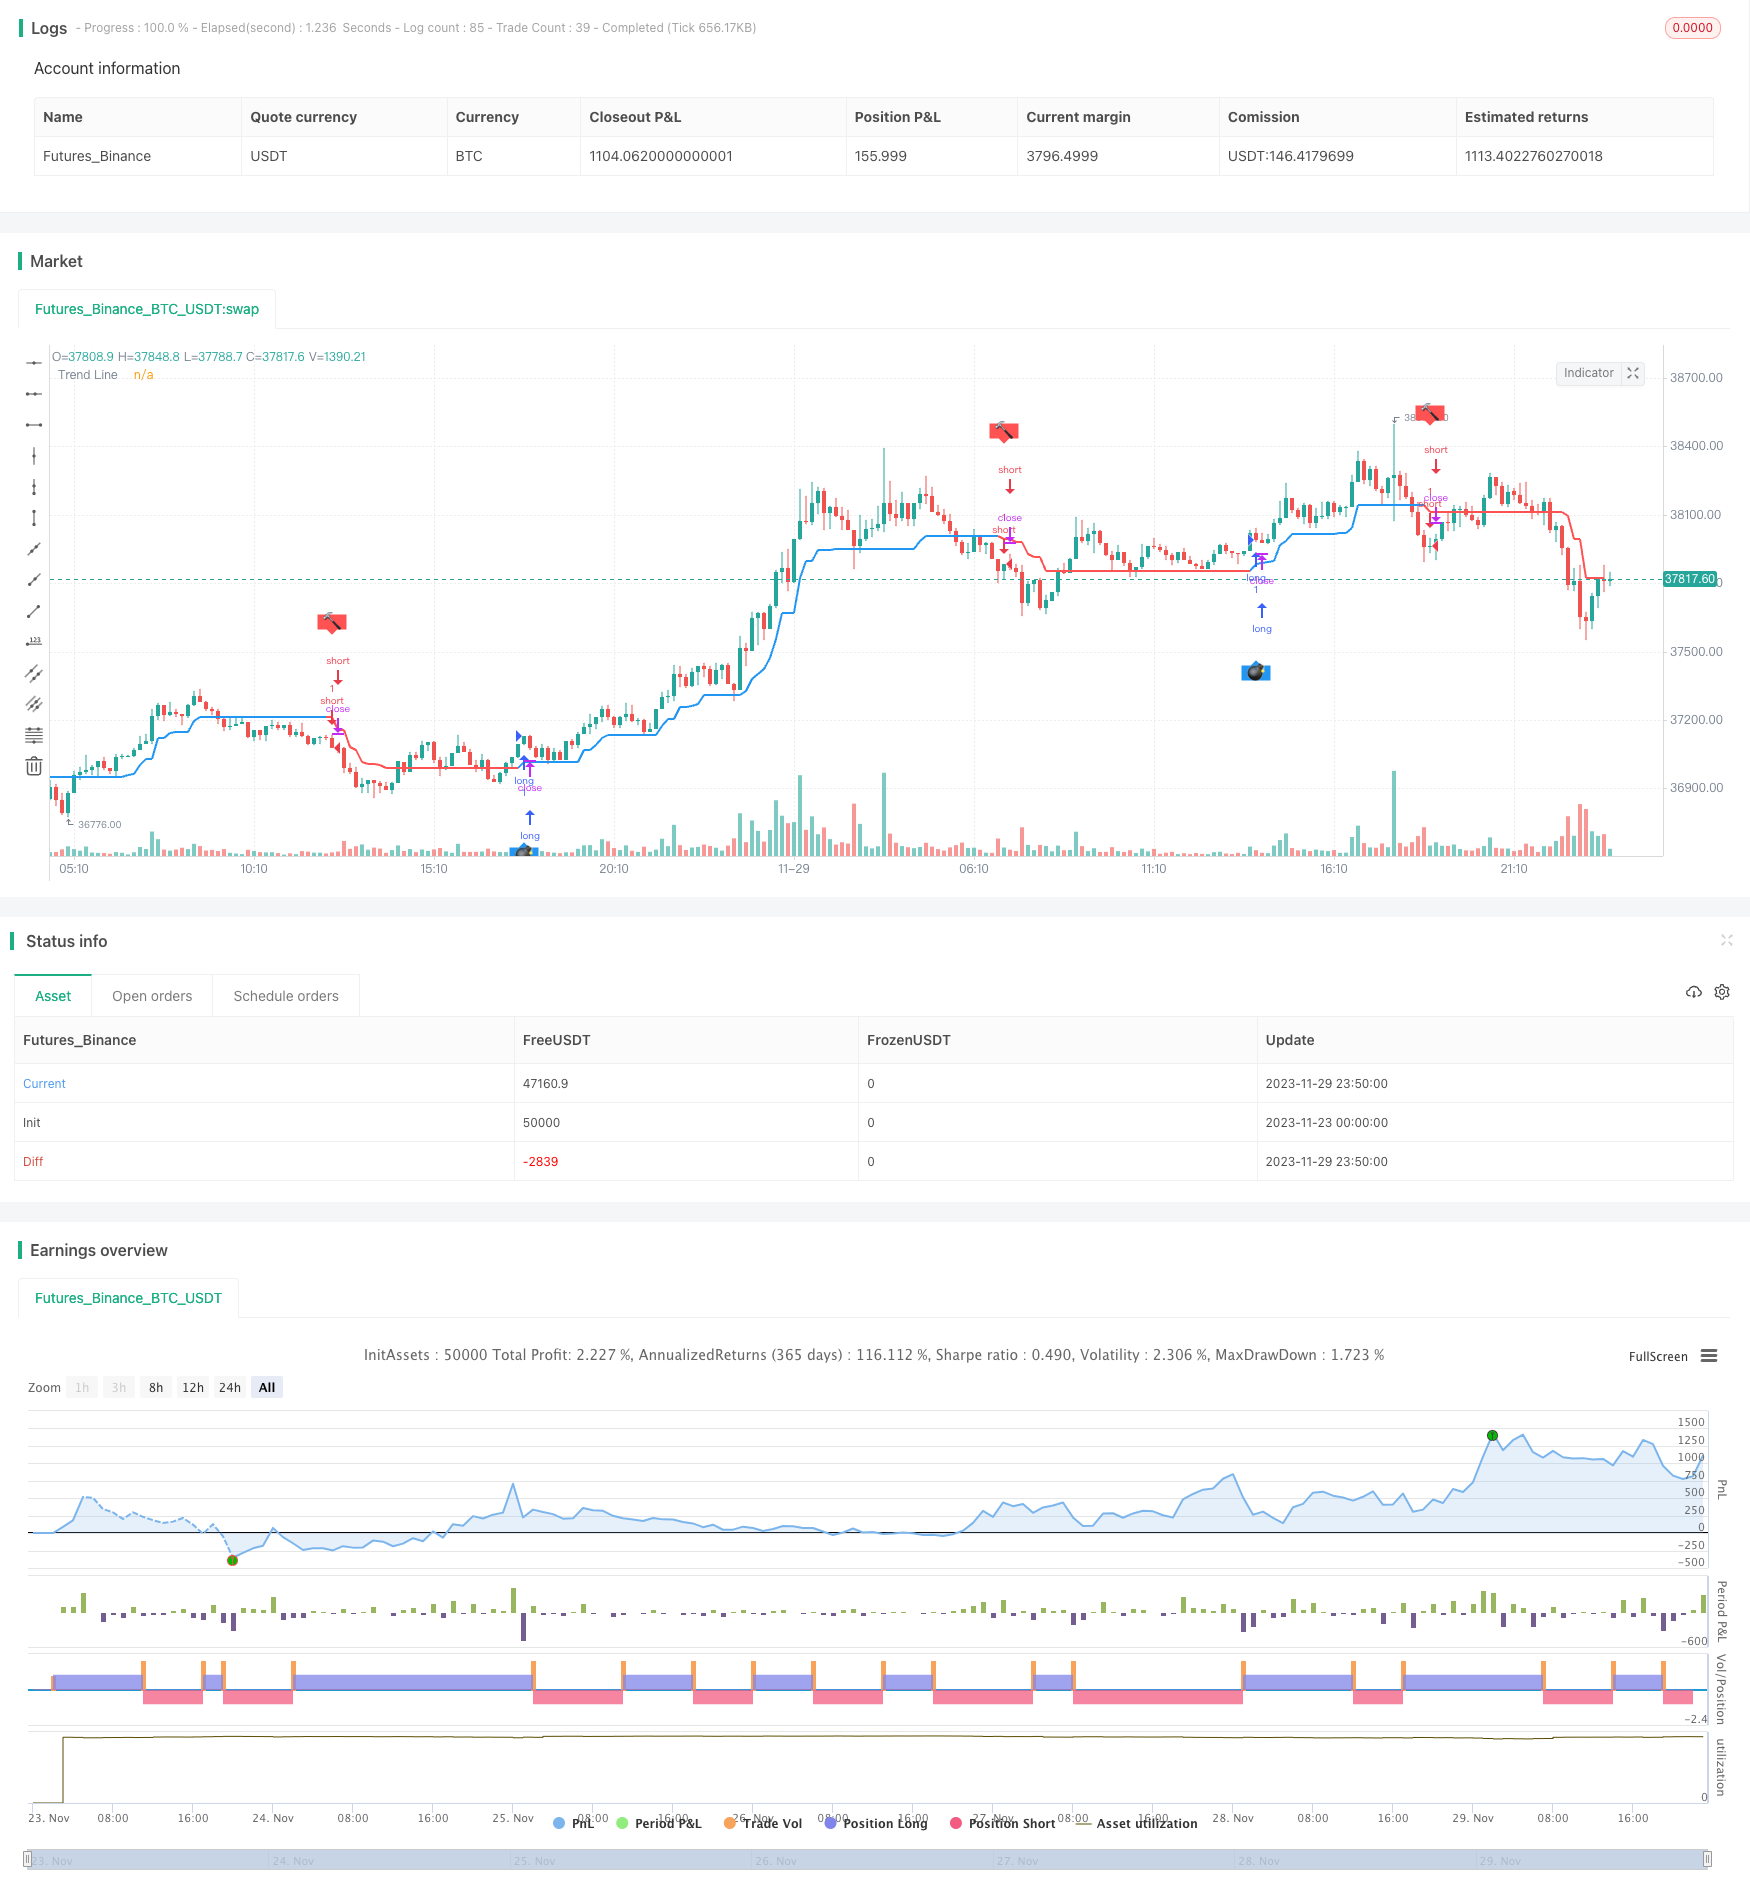
跟踪线策略是一种基于布林带指标和平均真实波动范围(ATR)的趋势跟踪策略。它会动态调整趋势判断线,在突破布林带上轨时向上调整,突破布林带下轨时向下调整,从而实现对趋势的判断和跟踪。
策略原理
该策略首先计算布林带的上下轨,以及平均真实波动范围。然后判断价格是否突破布林带上轨或者下轨。
当价格突破上轨时,如果开启ATR过滤,则将趋势判断线设置为最低价减去ATR;如果不开启ATR过滤,则直接设置为最低价。
当价格突破下轨时,如果开启ATR过滤,则将趋势判断线设置为最高价加上ATR;如果不开启ATR过滤,则直接设置为最高价。
这样,趋势判断线就可以根据价格突破布林带上下轨来动态调整,从而实现对趋势的判断。
当当前趋势判断线高于上一个趋势判断线时,表示目前处于上涨趋势;当当前趋势判断线低于上一个趋势判断线时,表示目前处于下跌趋势。
根据趋势判断,该策略可以进行做多做空操作。
优势分析
- 动态调整趋势判断线,能够灵活地捕捉价格趋势
- 结合布林带指标,能在价格突破时及时判断趋势转折
- ATR参数的引入,可以过滤部分假突破信号
风险分析
- 布林带参数选择不当,可能导致频繁的假突破
- ATR参数选择过大,可能导致错过趋势转折机会
- 需考虑止损,以防止极端行情带来的损失
可以通过参数调整、引入止损来规避部分风险。也可结合其它指标进行过滤,提高突破的有效性。
优化方向
- 优化布林带和ATR的参数,寻找最佳配置
- 添加其它指标判断来过滤假突破
- 针对特定交易品种选择布林带周期和ATR周期
总结
跟踪线策略致力于在波动行情下捕捉价格趋势,是一种有效的趋势跟踪策略。通过参数调整和优化,是可以获得不错的收益的。不过也需要考虑风控止损和防范假突破。建议将本策略与其它指标或策略组合使用,可以进一步提升收益率。
策略源码
/*backtest
start: 2023-11-23 00:00:00
end: 2023-11-30 00:00:00
period: 10m
basePeriod: 1m
exchanges: [{"eid":"Futures_Binance","currency":"BTC_USDT"}]
*/

// © Dreadblitz
//@version=4
//
// ▒▒▒▒▒▒▒▒▒▒▒▒▒▒▒▒▒▒▒▒▒▒▒▒▒▒▒▒▒▒▒▒▒▒▒▒▒▒▒▒▒▒▒▒▒▒▒▒▒▒▒▒▒▒▒▒▒▒▒▒▒▒▒▒▒▒▒▒▒▒▒▒▒▒▒▒▒▒▒▒▒▒▒▒▒▒▒▒▒▒▒▒▒▒▒▒▒▒▒▒▒▒▒▒▒▒▒▒▒▒▒▒▒▒ //

strategy(title = " Strategy Follow Line Indicator ",
         shorttitle = "S-FLI",
         overlay = true,
         precision = 8,
         calc_on_order_fills = true,
         calc_on_every_tick = true,
         backtest_fill_limits_assumption = 0,
         default_qty_type = strategy.fixed,
         default_qty_value = 2,
         initial_capital = 10000,
         pyramiding=1,
         currency = currency.USD,
         linktoseries = true)

//
// ▒▒▒▒▒▒▒▒▒▒▒▒▒▒▒▒▒▒▒▒▒▒▒▒▒▒▒▒▒▒▒▒▒▒▒▒▒▒▒▒▒▒▒▒▒▒▒▒▒▒▒▒▒▒▒▒▒▒▒▒▒▒▒▒▒▒▒▒▒▒▒▒▒▒▒▒▒▒▒▒▒▒▒▒▒▒▒▒▒▒▒▒▒▒▒▒▒▒▒▒▒▒▒▒▒▒▒▒▒▒▒▒▒▒ //

backTestSectionFrom = input(title = "═══════════════ From ═══════════════", defval = true, type = input.bool)

FromMonth         = input(defval = 1, title = "Month", minval = 1)
FromDay           = input(defval = 1, title = "Day", minval = 1)
FromYear          = input(defval = 2014, title = "Year", minval = 2000)

backTestSectionTo = input(title = "════════════════ To ════════════════", defval = true, type = input.bool)
ToMonth           = input(defval = 31, title = "Month", minval = 1)
ToDay             = input(defval = 12, title = "Day", minval = 1)
ToYear            = input(defval = 9999, title = "Year", minval = 2000)

Config            = input(title = "══════════════ Config ══════════════", defval = true, type = input.bool)
BBperiod          = input(defval = 21,     title = "BB Period",    type = input.integer, minval = 1)
BBdeviations      = input(defval = 1.00,     title = "BB Deviations",    type = input.float, minval = 0.1, step=0.05)
UseATRfilter      = input(defval = true, title = "ATR Filter",  type = input.bool)
ATRperiod         = input(defval = 5,     title = "ATR Period",    type = input.integer, minval = 1)
hl                = input(defval = false, title = "Hide Labels",  type = input.bool)


backTestPeriod() => true

//
//
// ▒▒▒▒▒▒▒▒▒▒▒▒▒▒▒▒▒▒▒▒▒▒▒▒▒▒▒▒▒▒▒▒▒▒▒▒▒▒▒▒▒▒▒▒▒▒▒▒▒▒▒▒▒▒▒▒▒▒▒▒▒▒▒▒▒▒▒▒▒▒▒▒▒▒▒▒▒▒▒▒▒▒▒▒▒▒▒▒▒▒▒▒▒▒▒▒▒▒▒▒▒▒▒▒▒▒▒▒▒▒▒▒▒▒ //

BBUpper=sma (close,BBperiod)+stdev(close, BBperiod)*BBdeviations
BBLower=sma (close,BBperiod)-stdev(close, BBperiod)*BBdeviations
//
TrendLine = 0.0
iTrend = 0.0
buy = 0.0
sell = 0.0
//
BBSignal = close>BBUpper? 1 : close<BBLower? -1 : 0
//
if BBSignal == 1 and UseATRfilter == 1
    TrendLine:=low-atr(ATRperiod)
    if TrendLine<TrendLine[1]
        TrendLine:=TrendLine[1]
if BBSignal == -1 and UseATRfilter == 1
    TrendLine:=high+atr(ATRperiod)
    if TrendLine>TrendLine[1]
        TrendLine:=TrendLine[1]
if BBSignal == 0 and UseATRfilter == 1
    TrendLine:=TrendLine[1]
//
if BBSignal == 1 and UseATRfilter == 0
    TrendLine:=low
    if TrendLine<TrendLine[1]
        TrendLine:=TrendLine[1]
if BBSignal == -1 and UseATRfilter == 0
    TrendLine:=high
    if TrendLine>TrendLine[1]
        TrendLine:=TrendLine[1]
if BBSignal == 0 and UseATRfilter == 0
    TrendLine:=TrendLine[1]
//
iTrend:=iTrend[1]
if TrendLine>TrendLine[1]
    iTrend:=1
if TrendLine<TrendLine[1]
    iTrend:=-1
//
buy:=iTrend[1]==-1 and iTrend==1 ? 1 : na
sell:=iTrend[1]==1 and iTrend==-1? 1 : na
//
plot(TrendLine, color=iTrend > 0?color.blue:color.red ,style=plot.style_line,linewidth=2,transp=0,title="Trend Line")
plotshape(buy == 1 and hl == false? TrendLine-atr(8) :na, text='💣', style= shape.labelup, location=location.absolute, color=color.blue, textcolor=color.white, offset=0, transp=0,size=size.auto)
plotshape(sell == 1 and hl == false ?TrendLine+atr(8):na, text='🔨', style=shape.labeldown, location=location.absolute, color=color.red, textcolor=color.white, offset=0, transp=0,size=size.auto)

// Strategy Entry
if (backTestPeriod())
    strategy.entry("long", true, 1, when = buy == 1)
    strategy.entry("short", false, 1, when = sell == 1)