Fisher Transform Backtest Strategy

Overview
The Fisher Transform backtest strategy calculates the Fisher transform of prices to identify price reversal points and generate trading signals accordingly. The strategy processes prices using the Fisher transform formula to remove non-Gaussian features of price distributions, resulting in a standardized indicator with an approximate Gaussian distribution. The strategy determines price reversals based on inflection points of the Fisher transform curve and produces long and short signals.
Strategy Principle
The core of this strategy is to process prices using the Fisher transform formula to eliminate non-Gaussian features of natural price distributions. The Fisher transform formula is:
y = 0.5 * ln((1+x)/(1-x))
Here x is the processed price, obtained by first finding the highest and lowest prices over the most recent Length periods using the highest and lowest functions, and then normalizing as follows:
x = (price - minimum)/(maximum - minimum) - 0.5
Prices processed this way approximate a Gaussian distribution. x is then substituted into the Fisher transform formula to obtain the Fisher transform curve. Inflection points in the Fisher transform curve signal price reversals.
When the Fisher transform curve turns from positive to negative, a sell signal is generated. When it turns from negative to positive, a buy signal is generated.
Advantage Analysis
-
The Fisher transform removes non-Gaussian features from prices, resulting in more well-behaved, standardized prices and fewer false signals
-
Captures price reversal points, avoiding chasing tops and bottoms
-
Flexible parameter adjustment for tuning reversal sensitivity
-
Customizable directionality, adapts to various market environments
-
Simple logic easy to understand and implement
Risk Analysis
-
Improper parameter settings may miss turns or generate false signals
-
Slippage in live trading may prevent perfect signal execution
-
Hard to identify turns when prices are volatile
-
Difficult to implement in live trading with need to confirm reversals
Solutions:
-
Optimize parameters by adjusting Length
-
Relax entry criteria appropriately to ensure fills
-
Filter false signals combining other indicators
-
Strictly follow rules and manage risks
Optimization Directions
-
Optimize Length parameter to find best combination
-
Add filters to avoid false signals e.g. moving averages, volatility indicators etc.
-
Incorporate stop loss to control loss per trade
-
Add re-entry mechanism to track continuing trends
Conclusion
The Fisher Transform backtest strategy identifies price reversal points by removing non-Gaussian price features. It is an easily implemented mean reversion strategy. Its advantages lie in flexible parameters for catching turns while its main weakness is the difficulty of live implementation with the need for strict entry rules. Various methods can be used to optimize this strategy for practical applicability.
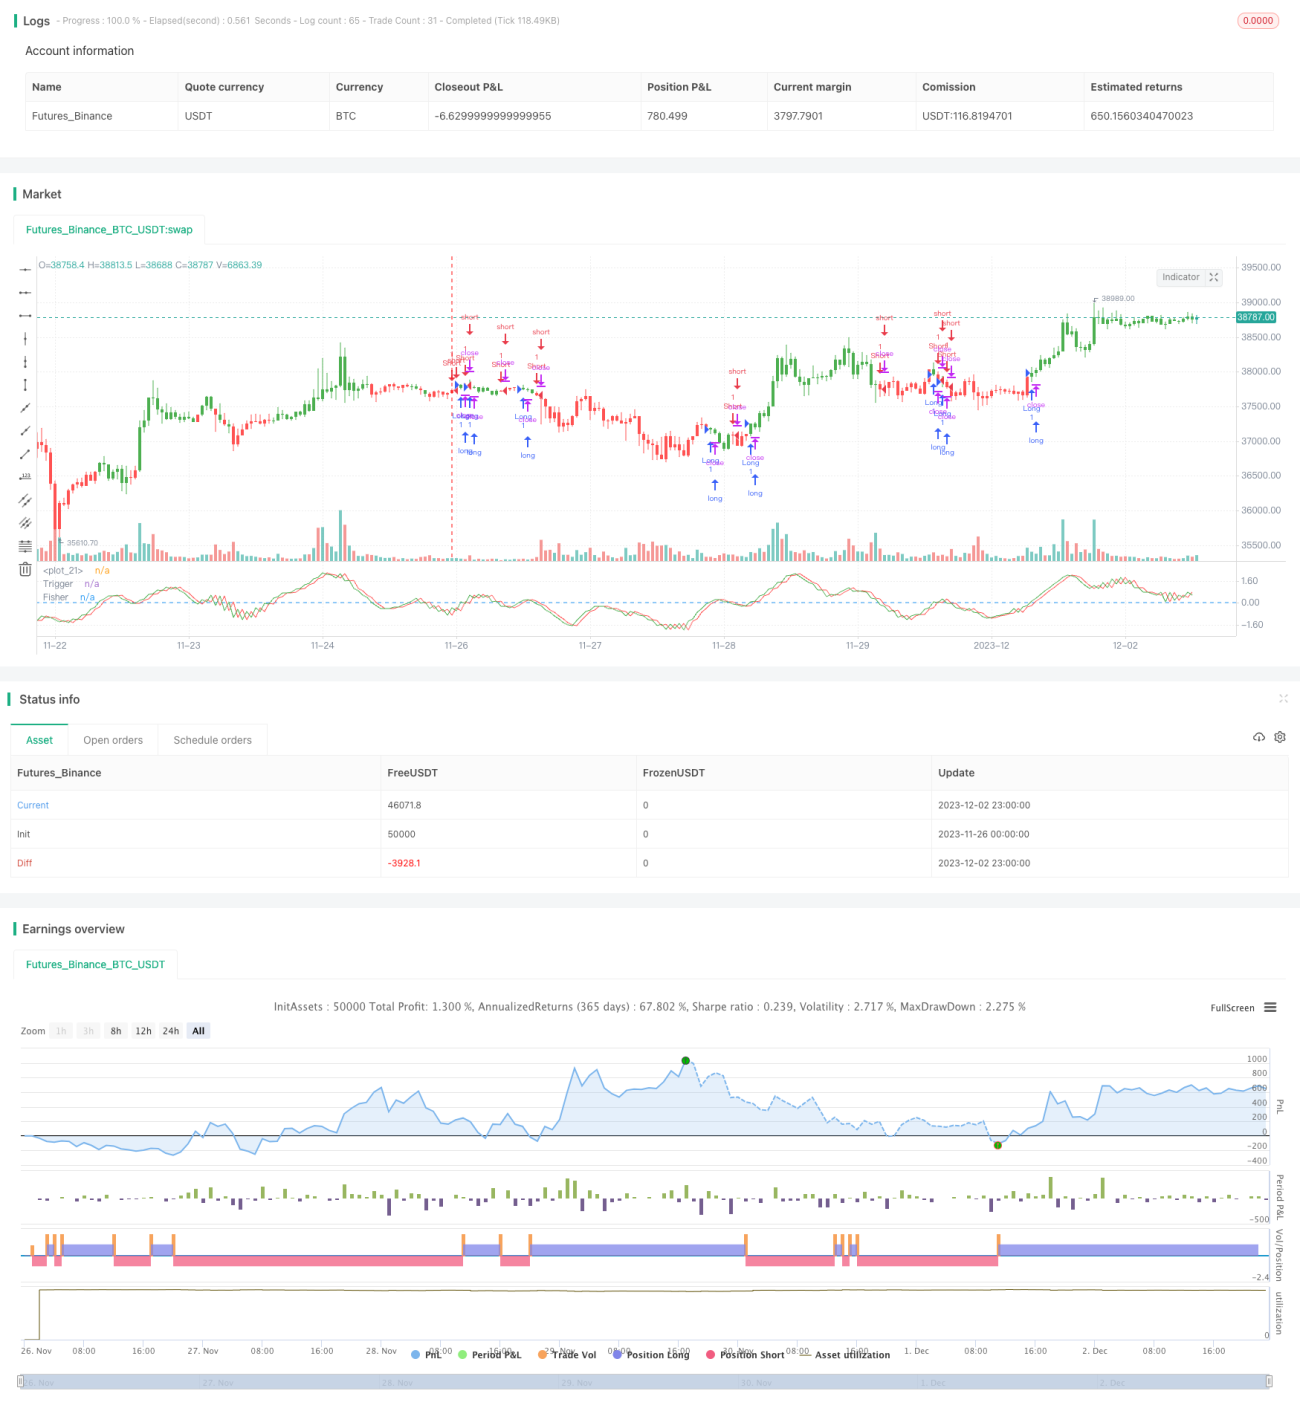
/*backtest
start: 2023-11-26 00:00:00
end: 2023-12-03 00:00:00
period: 1h
basePeriod: 15m
exchanges: [{"eid":"Futures_Binance","currency":"BTC_USDT"}]
*/

//@version = 2
////////////////////////////////////////////////////////////
//  Copyright by HPotter v2.0 22/12/2016
// Market prices do not have a Gaussian probability density function- 1