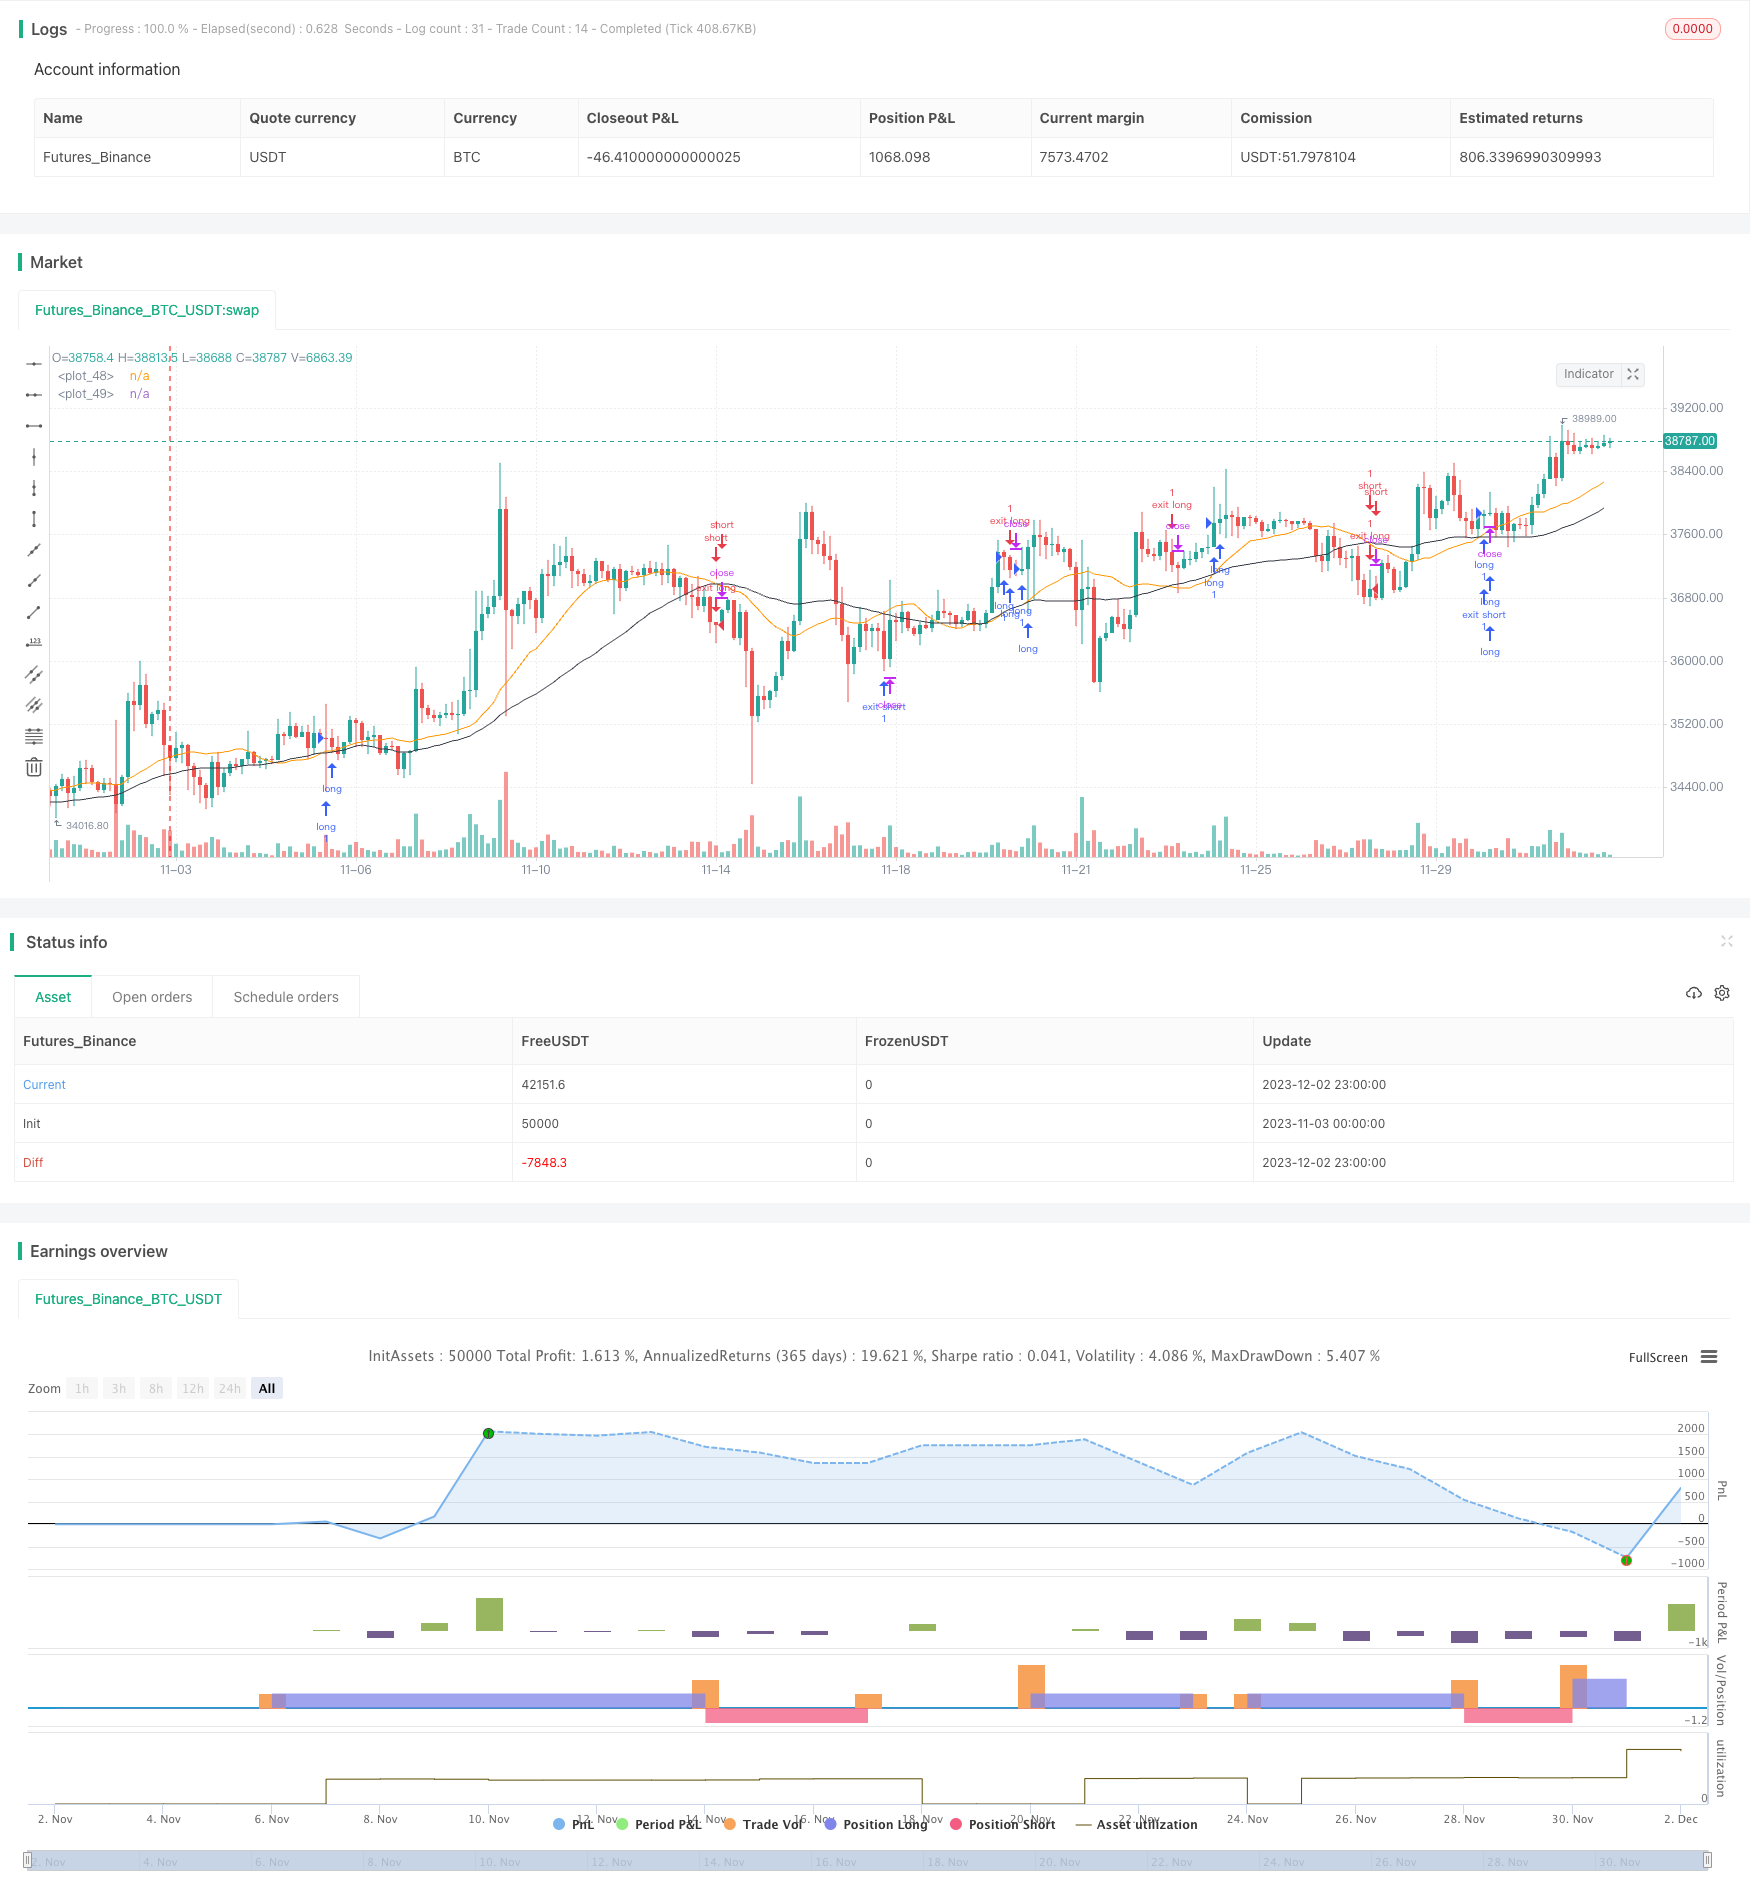
概述
这个策略是基于比特币的移动平均线交叉原理设计的趋势跟随交易策略。策略使用快速移动平均线和慢速移动平均线的交叉作为买入和卖出信号。当快速移动平均线上穿慢速移动平均线时,视为金叉,做多;当快速移动平均线下穿慢速移动平均线时,视为死叉,做空。同时,策略还结合RSI指标避免莽夫入场。
策略原理
该策略主要基于两个指标:
移动平均线(Moving Average,MA):计算一定周期内的收盘价平均值,用于判断价格走势和发生转折的信号。
相对强弱指数(Relative Strength Index,RSI):计算一定周期内股价涨跌速度,判断超买超卖区域。
具体来说,策略使用长度较短的MA作为快线,长度较长的MA作为慢线。当快线上穿慢线时,表示短期价格上涨加速,产生买入信号;当快线下穿慢线时,表示短期价格下跌加速,产生卖出信号。
同时,策略还设置RSI的阈值,仅在RSI高于50时产生买入信号,RSI低于50时产生卖出信号,避免在价格剧烈波动时莽夫入场。
策略优势
该策略具有以下优势:
- 原理简单,容易理解和实现。
- 可靠的交易信号,避免了非理性入场。
- 参数较少,易于优化。
- 移动平均线技术成熟,应用广泛。
- RSI指标可有效 indentify 超买超卖现象。
风险分析
该策略也存在一些风险:
- 跟随趋势策略,容易在价格反转时造成较大亏损。
- 移动平均线滞后,无法及时捕捉价格转折。
- 错误参数选择可导致交易信号质量下降。
- 策略仅基于技术指标,没有考虑基本面因素。
为降低风险,建议优化移动平均线周期参数,调整止损位置,适当缩小仓位规模。当基本面发生重大变化时,应暂停使用该策略。
优化方向
该策略有以下几个主要优化方向:
优化移动平均线周期参数,找到最佳参数组合。可以通过逐步搜索、遗传算法等方法来优化。
增加其他技术指标过滤,如KDJ、MACD等,提高交易信号质量。
增加对价格波动的监控,根据波动率调整仓位和止损。
结合交易量,避免虚假突破。只在成交量放大的情况下发出信号。
开发参数自适应机制。允许策略根据不同市场环境,自动调整参数取值。
总结
本策略总体来说是一种较为典型的趋势跟随策略。基于移动平均线交叉原理,交易逻辑简单清晰,容易理解和实现。同时融入RSI指标可避免非理性交易。该策略可谓风险和收益并存,适合有一定量化交易经验的投资者使用,但需要注意防范潜在的亏损风险。如果开发人员能够加入更多过滤条件,优化参数自适应性,便可进一步提高策略的稳定盈利能力。
/*backtest
start: 2023-11-03 00:00:00
end: 2023-12-03 00:00:00
period: 3h
basePeriod: 15m
exchanges: [{"eid":"Futures_Binance","currency":"BTC_USDT"}]
*/

//@version=4
//Trading Strategy Warning - Past performance may not equal future performance
//Account Size Warning - Performance based upon default 10% risk per trade, of account size $100,000. Adjust before you trade to see your own drawdown.
//Time Frame - D1 and H4, warning H4 has a lower profit factor (fake-outs, and account drawdown), D1 recommended
//Trend Following System - Profitability of this system is dependent on a STRONG trend in Bitcoin, into the future
strategy("Bitcoin - MA Crossover Strategy", overlay=true)

// User Input
usr_risk = input(title="Equity Risk (%)",type=input.integer,minval=1,maxval=100,step=1,defval=10,confirm=false)
sma_fast = input(title="Fast MA (Period)",type=input.integer,minval=1,maxval=500,step=1,defval=20,confirm=false)
sma_slow = input(title="Slow MA (Period)",type=input.integer,minval=1,maxval=500,step=1,defval=40,confirm=false)
rsi_valu = input(title="RSI (Period)",type=input.integer,minval=1,maxval=500,step=1,defval=14,confirm=false)

// Create Indicator's
shortSMA = sma(close, sma_fast)
longSMA = sma(close, sma_slow)
rsi = rsi(close, rsi_valu)
strategy.initial_capital = 50000
// Units to buy
amount = usr_risk / 100 * (strategy.initial_capital + strategy.netprofit)
units = floor(amount / close)

// Specify entry conditions
longEntry = crossover(shortSMA, longSMA)
shortEntry = crossunder(shortSMA, longSMA)

// Specify exit conditions
longExit = crossunder(shortSMA, longSMA)
shortExit = crossover(shortSMA, longSMA)

// Execute long trade
if (longEntry)
    strategy.entry("long", strategy.long, units, when = rsi > 50)

// Exit long trade
if(longExit and strategy.position_size > 0)
    strategy.order("exit long", strategy.short, abs(strategy.position_size))

// Execute short trade
if (shortEntry)
    strategy.entry("short", strategy.short, units, when = rsi < 50)

// Exit short trade
if(shortExit and strategy.position_size < 0)
    strategy.order("exit short", strategy.long, abs(strategy.position_size))

// Plot Moving Average's to chart
plot(shortSMA)
plot(longSMA, color=color.black)