High Minus Exponential Moving Average Stock Strategy

Overview
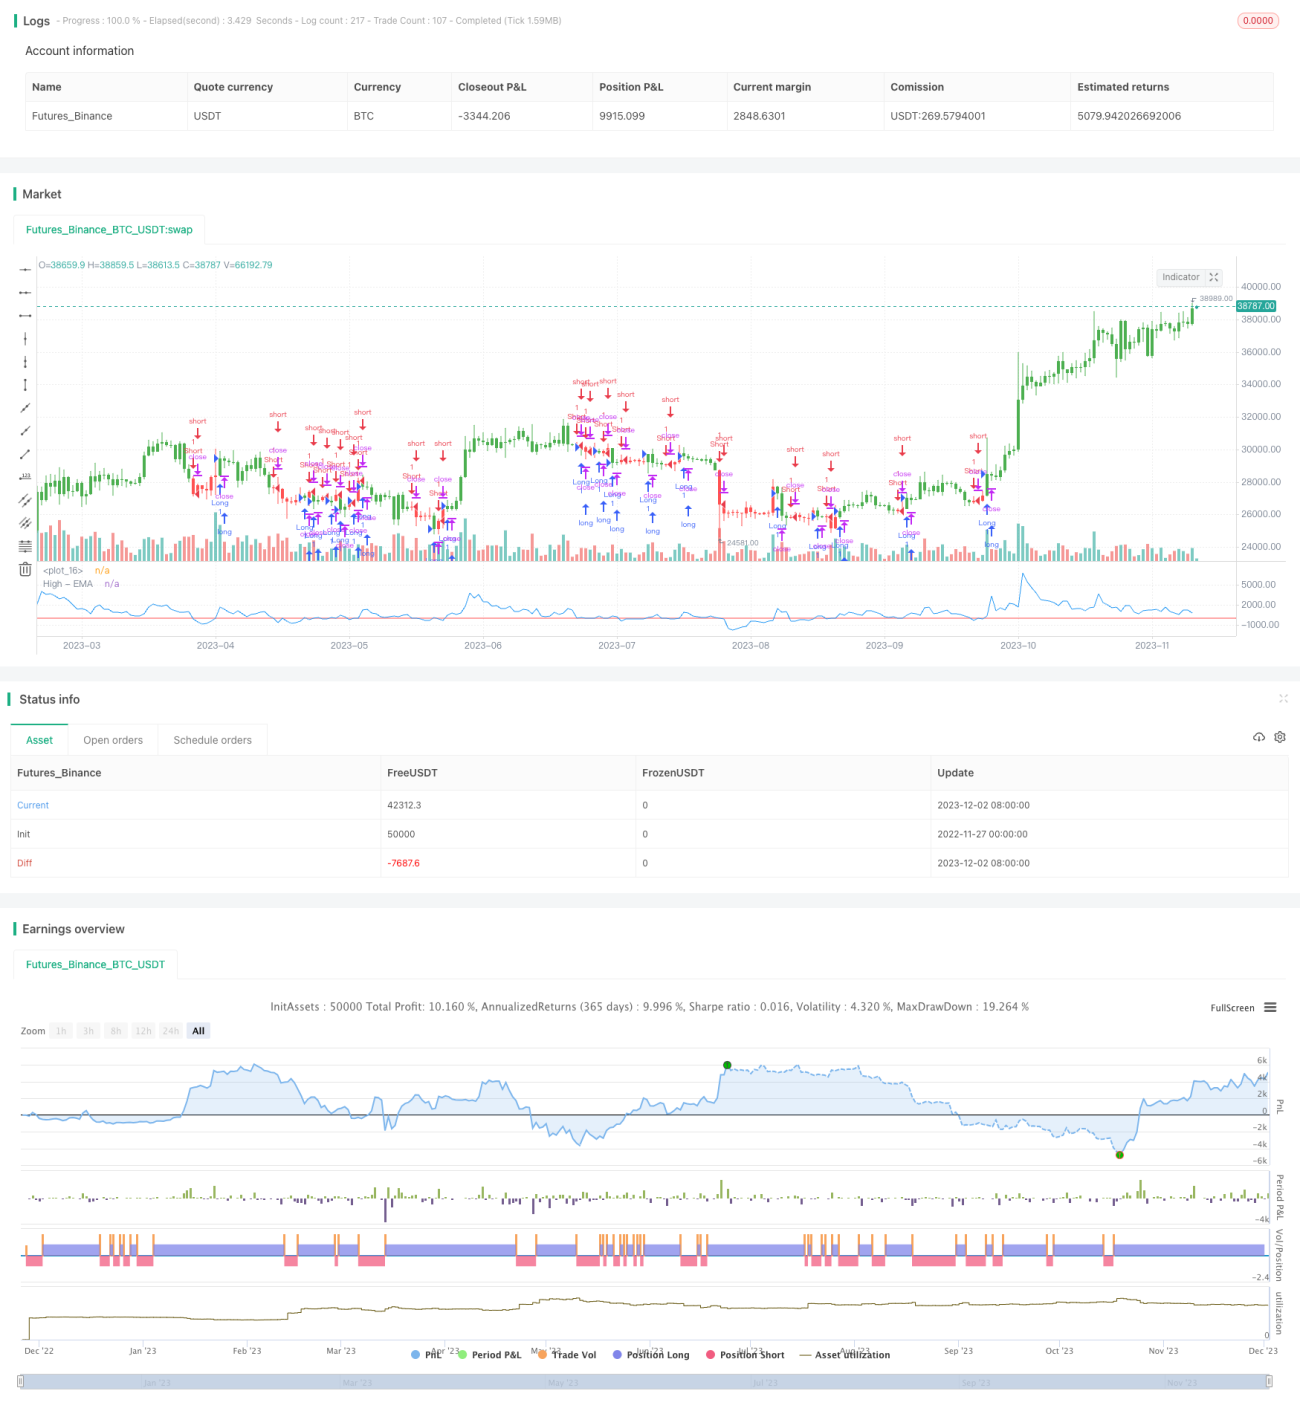
The High Minus Exponential Moving Average Stock Strategy is a quantitative investment strategy that makes trading decisions based on the high price of a stock and its exponential moving average (EMA). It calculates the difference between the high price of the previous period and the 13-period EMA of the close price of the previous period. If the difference is greater than 0, it goes long. If the difference is less than 0, it goes short. This strategy belongs to the trend-following type.
Strategy Logic
The core indicator of this strategy is the High Minus Exponential Moving Average (HMEMA). Specifically, it takes the high price of the previous period and subtracts the 13-period EMA of the close price of the previous period. When this difference is greater than 0, it means the latest stock price has reached a new high and has entered a bullish trend, so it should go long. When the difference is less than 0, it means the stock price is below its recent average level and has entered a bearish trend, so it should go short.
The logic behind this is when stock price reaches a new high, it signals the start of an uptrend, so a long position should be taken. When the price breaks below its recent average, it signals the start of a downtrend, so a short position should be taken. This way, the strategy is able to capture major turning points in the price trend and follow trends.
Advantages
-
This strategy is able to capture major turning points of stock price trends. It enters orders when prices reach new highs or break through moving averages, thus reducing trade frequency while catching key levels.
-
The use of exponential moving averages provides a smoother reflection of price moves, filtering out short-term market noises.
-
The strategy logic is simple and clear, easy to understand and modify, suitable for beginners to learn.
-
This strategy is flexible enough to be applied to stocks, forex, crypto currencies in different time frames.
Risks
-
This strategy fails to determine exact entry and exit levels, posing certain risks of trend-chasing.
-
It may generate false signals when prices are ranging, causing over-trading risks. Parameters can be adjusted or filters added to reduce such risks.
-
The strategy does not consider the actual volatility of stock prices, risking oversized losses. Stop loss can be set to control risks.
-
The strategy does not incorporate overall market conditions, fundamentals of individual stocks to determine directions, running the risk of poor signal effects.
Optimization
-
Consider incorporating price volatility to issue signals only when volatility increases, so as to reduce misleading trades.
-
Adding filters such as a double confirmation from fast and slow simple moving averages may help avoid false signals.
-
Parameters like moving average periods, price series for comparison can be optimized to find the optimal combination.
-
Consider switching parameters or indicators based on market states to improve adaptability.
Conclusion
The High Minus Exponential Moving Average Stock Strategy designs a simple but effective way of tracking stock trends by comparing high prices with exponential moving averages. It captures major turning points when prices break to new highs or moving average levels, thus catching key spots with fewer trades. Exponential moving averages also filter out market noises. This strategy suits medium- to long-term trend-following trading of stocks, forex, crypto currencies and more. Further optimizations may lead to improved strategy performance.
/*backtest
start: 2022-11-27 00:00:00
end: 2023-12-03 00:00:00
period: 1d
basePeriod: 1h
exchanges: [{"eid":"Futures_Binance","currency":"BTC_USDT"}]
*/

//@version=2
////////////////////////////////////////////////////////////
//  Copyright by HPotter v1.0 20/16/2016
// This indicator plots the difference between the High (of the previous period)- 1