Multi Indicator Quantitative Trading Strategy

Overview
This strategy integrates moving averages, relative strength index (RSI) and moving average convergence divergence (MACD), three major technical indicators, to automatically open and close long and short positions. The strategy name contains "Multi Indicator" to highlight the multiple indicators used in this strategy.
Strategy Logic
The strategy mainly judges the trend direction by comparing two moving averages, and combines the RSI indicator to avoid missing reversal opportunities. Specifically, the strategy uses EMA or SMA to calculate the fast line and slow line. The fast line crossing above the slow line is the buy signal, and the fast line crossing below is the sell signal. To filter false breakthroughs, the strategy also sets the logic of the RSI indicator, only when the RSI indicator also meets the condition, the trading signal will be triggered.
In addition, the MACD indicator is also integrated into the strategy for trading decisions. When the difference between MACD indicator crosses above the 0 axis, it is a buy signal, and when it crosses below, it is a sell signal. This can help judge whether the trend has reversed to avoid wrong signals at inflection points.
Advantage Analysis
The biggest advantage of this strategy is to integrate multiple indicators to filter signals, which can effectively reduce false signals and improve signal quality. Specifically, the advantages are as follows:
-
The fast and slow lines combined with the RSI indicator can avoid false breakthroughs caused by the single use of moving averages.
-
The integration of the MACD indicator can judge whether the trend has reversed prematurely to avoid wrong signals at the turning point.
-
Choosing between EMA and SMA allows selecting indicators that are more suitable for different market characteristics.
-
Choosing money management schemes allows controlling the size of single orders to effectively control risks.
-
Supporting stop loss and take profit allows locking in profits and avoiding losses enlarging.
Risk Analysis
The main risks of this strategy include:
-
Improper parameter optimization may lead to poor strategy performance. Need to spend time testing different parameter combinations.
-
The probability of the indicator issuing wrong signals still exists. When the three indicators issue wrong signals at the same time, it will lead to greater losses.
-
The performance of a single symbol is unstable, it is necessary to expand to other varieties.
-
Datenicht zureichen, Strategie effekt wird in der Zukunft abnehmen.
Optimization Directions
The main aspects for optimizing this strategy include:
-
Test different combinations of indicator parameters to find the optimal parameters.
-
Increase trailing stop in the stop loss mechanism. After the price runs a certain distance, it can trail stop to lock in profits.
-
Increase judgment indicators for major trend to avoid trading against the trend. For example, integrate the ADX indicator.
-
Fügen Sie Moneymanagement Module hinzu für besseres Risikomanagement.
-
Fügen Sie Filter für fundamentale Faktoren wie Nachrichten hinzu.
Summary
This strategy realizes finding and filtering long and short positions by integrating multiple technical indicators such as moving averages, RSI and MACD. Its advantage is that it can effectively filter out false signals and improve signal quality. The main drawbacks are the parameter selection and the probability of indicators issuing wrong signals still exist. Future optimization directions include parameter optimization, stop loss optimization, trend filtering, etc. Overall, this strategy is effective as a multi-indicator strategy framework, and needs further optimization and verification going forward.
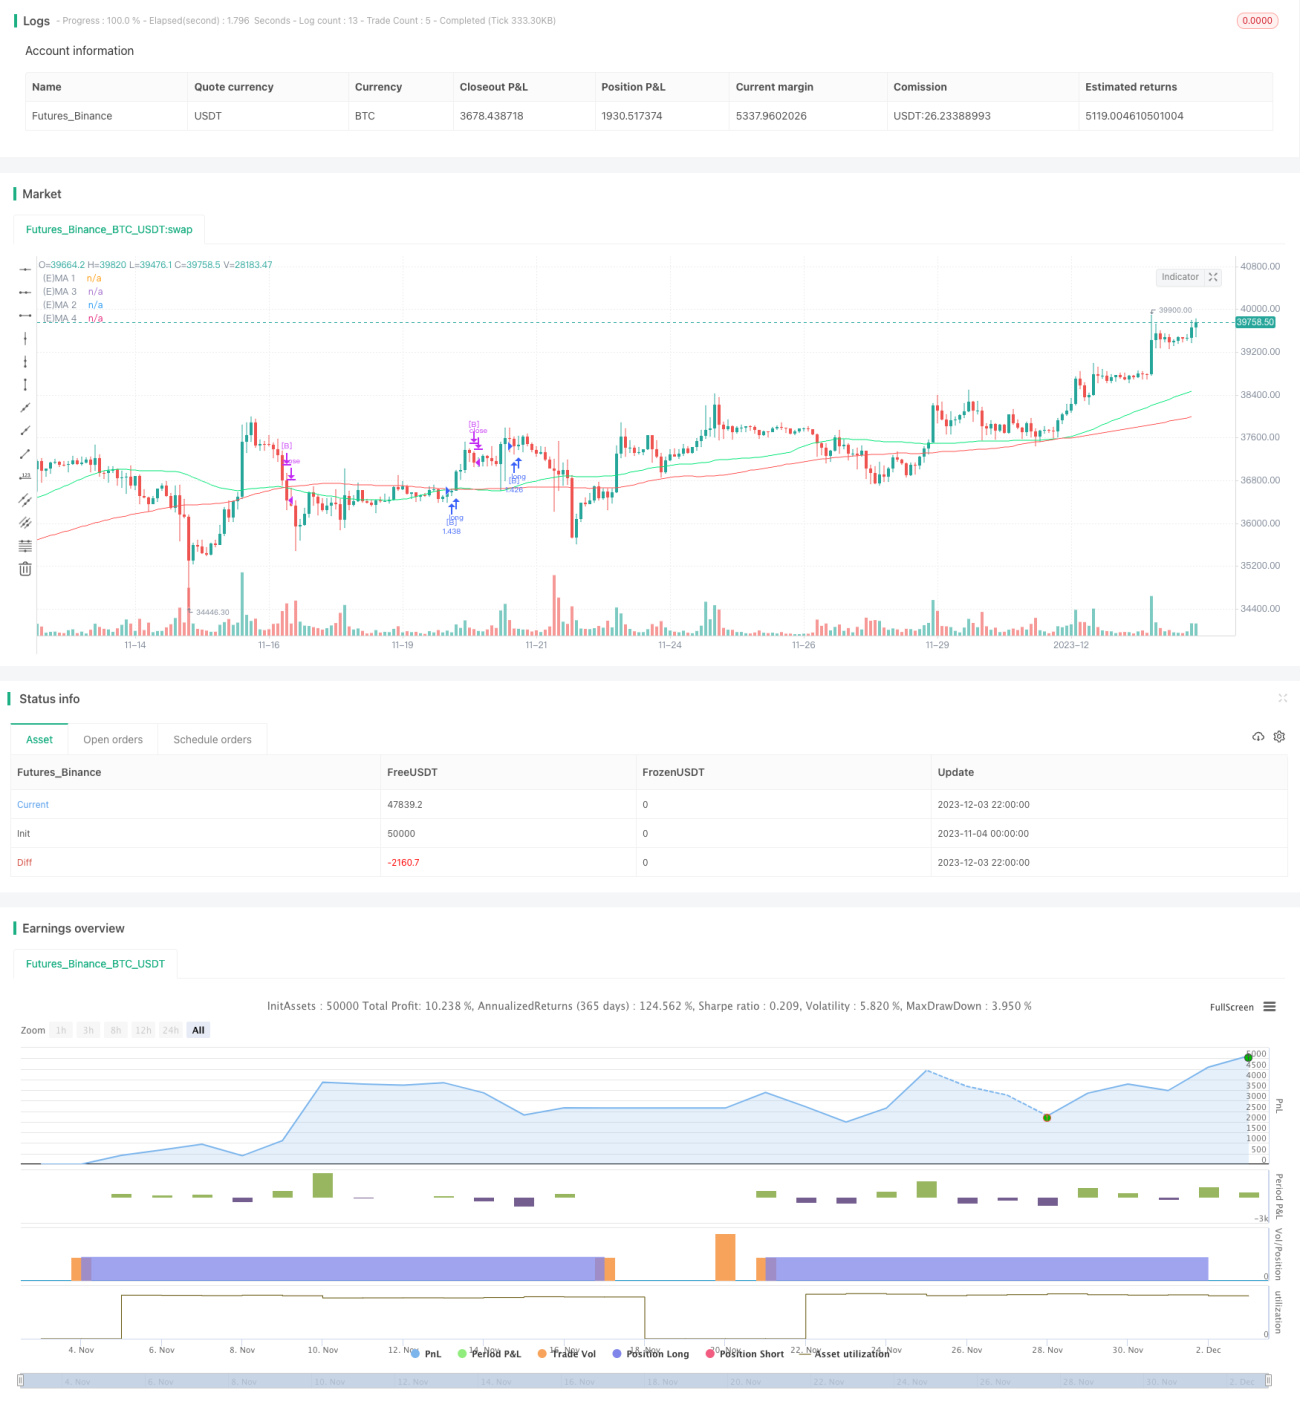
/*backtest
start: 2023-11-04 00:00:00
end: 2023-12-04 00:00:00
period: 2h
basePeriod: 15m
exchanges: [{"eid":"Futures_Binance","currency":"BTC_USDT"}]
*/

// This source code is subject to the terms of the Mozilla Public License 2.0 at https://mozilla.org/MPL/2.0/
// © fikira
//@version=4
strategy("Strategy Tester EMA-SMA-RSI-MACD", shorttitle="Strat-test", overlay=true, max_bars_back=5000, - 1